Are you about to publish a paper on Cell Press?
This is a great moment for anyone in a scientific career. After years of hard work, it is always rewarding to publish your results in a prestigious scientific journal.
At this moment you probably noticed that you need to create a graphical abstract for Cell Press, right? Sometimes this is not an easy task for scientists. We are not used to thinking about design, image composition, and arrangement.
To help you with this we created this tutorial for you, combining information from the Cell Press Guidelines and design tips from Mind the graph.
Why do I need a graphical abstract at the first place?
Cell Press defines graphical abstract as a “single‐panel image that is designed to give readers an immediate understanding of the take‐home message of the paper.” Its intent is to encourage browsing, promote interdisciplinary scholarship. Furthermore, it helps readers to quickly identify which papers are most relevant to their research interests.
A graphical abstract is a visual representation of the main point of your work. It allows the reader to see at a first glance a summarization of your paper and then decide to read it – or not. In a world where no one has time to waste plus a crescent ocean of information available, you need to be assertive and attractive to reach your audience.
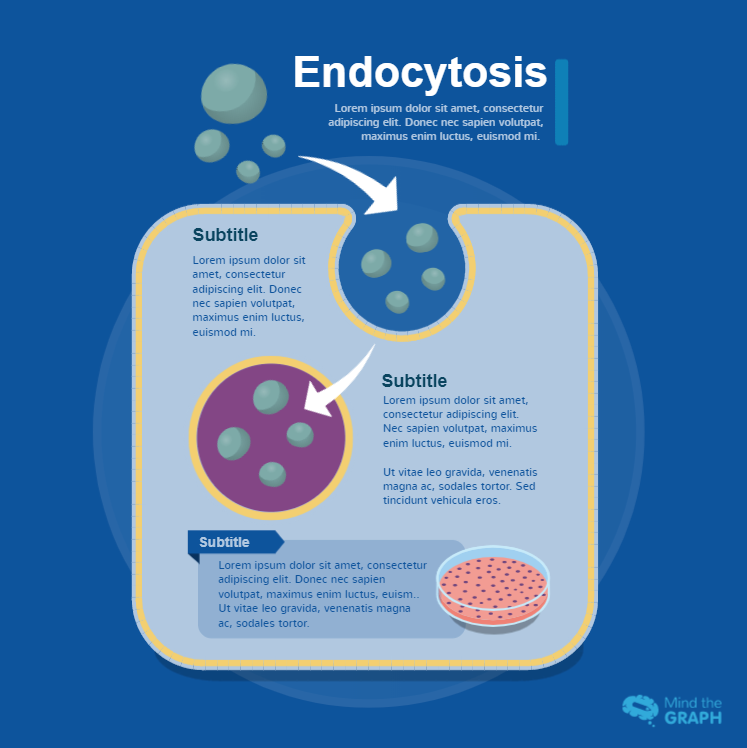
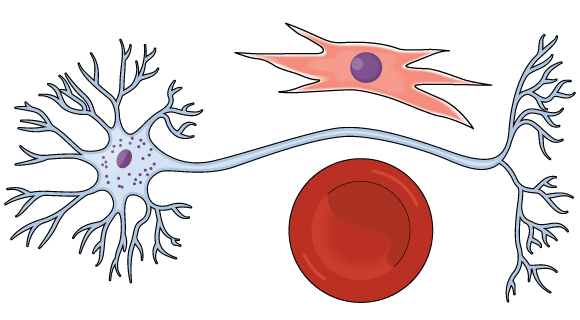
Look at this example of a graphical abstract created by a mind the graph user in a paper about Alzheimer’s disease:

Beautiful and informative, right? To see more users figures created using Mind the Graph’s platform check our Mind the Graph Experience Blog articles.
In Mind the Graph Experience Blog articles we gather many figures from published papers, with a brief explanation about the main idea of the figure.
Click Here to start using Mind the Graph, the Graphical Abstract Maker
Cell Press graphical abstract guidelines
Step one | Basic Guidelines
- Your image needs to be 1200 pixels square at 300 dpi in pdf, jpeg or tiff format.
- Visual identity: They reccommend the use of colors that are consistent with and complementary to the colors used on the Cell Press website. Heavily saturated, primary colors can be distracting.
- Font: Use Arial, 12-16 points. The graphical abstract is a visual creation, so do NOT use too much text, only the necessary. Use few words and the recommended size because smaller fonts will be ineligible online.
- The graphical abstract must be different of the other diagrams in your paper.
On Mind the graph you can set the canvas 1200×1200 and download it with 300dpi in pdf format. So you are able to create the entire graphical abstract using mind the graph. It is a good idea to save time and create a very professional graphical abstract for your publication.
Step two | Content
Focus on new findings – the most important information of your paper.
Prioritize the information and keep in mind that a graphical abstract is designed to give readers an immediate understanding of the take‐home message of the paper.
You need to inform the basic and attract the reader for more information.
- Do not include data items of any type, all the content should be in a graphical form
- Emphasize the new findings from the current paper and avoid details from previous literature
- Avoid the inclusion of features that are more speculative (unless the speculative nature can be made apparent visually)
You can read more about that here.

Step Three | Arrangement
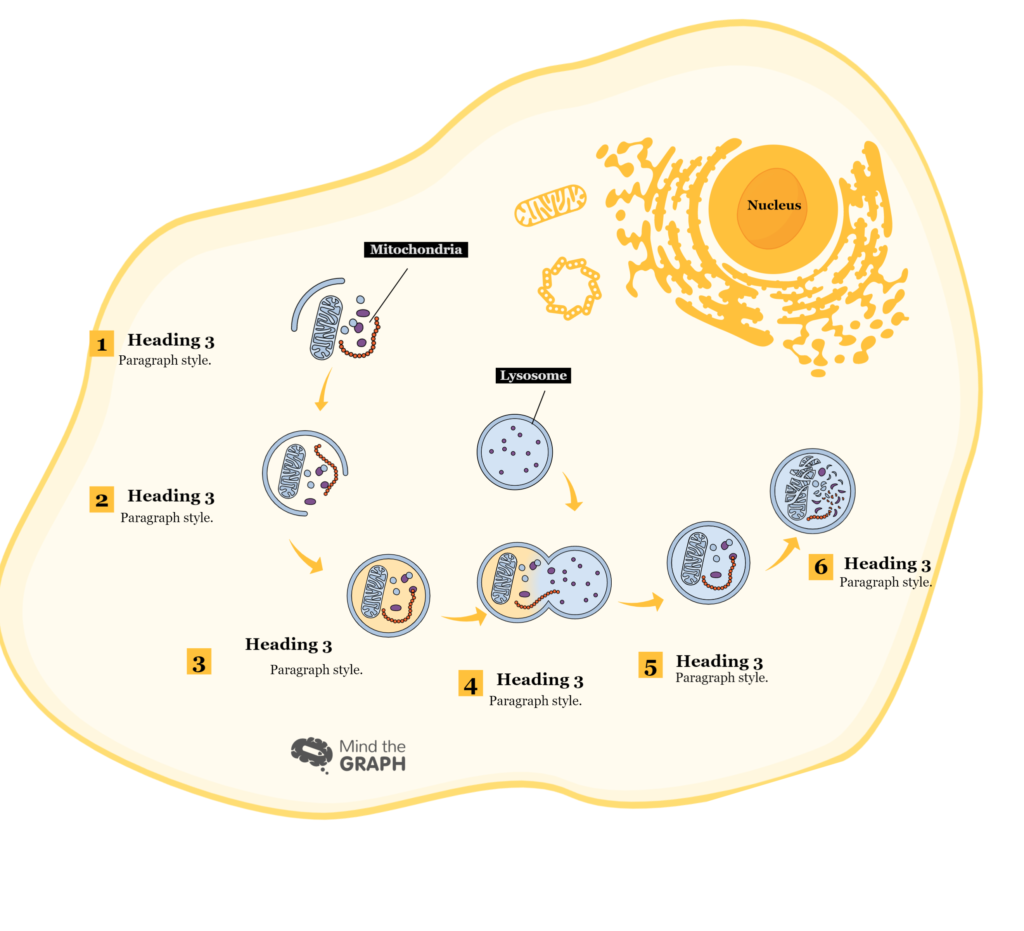
Illustrations, photos, colors, and other visual elements are an ally to enhance the graphical abstract both aesthetically and by directing the reader’s attention to focal points of interest. The graphical abstract tells a story. You can create flow by connecting steps in a process with a line, or by using arrows to point readers towards the next step.
- Have a clear start and end, “reading” from top‐to‐bottom or left‐to‐right
- Provide a visual indication of the biological context of the results depicted (subcellular location, tissue or cell type, species,
etc.) - Highlight one process or make one point clear
- Be free of distracting and cluttering elements
All illustrations from Mind the Graph have a design pattern so you can mix them and have a harmonic creation. Try different colors, fonts and change the size of the elements to see possible arrangements. You can also upload photography or an image of a chart to complete your graphical abstract.
Click Here to start using Mind the Graph, the Graphical Abstract Maker
Do you want to save time? Start from templates
You will find graphical abstract templates on mind the Graph. This way you don’t need to start from a blank canvas. Choose the one you liked most and esit to insert your content. You also can edit the page size to fit the cell press graphical abstract guidelines, change the illustrations and customize the way you want.
Free users can visualize the templates but not edit them. If you are a free user, you can use the template as an inspiration to your creation or upgrade your plan to have access to all features of Mind the Graph.


Subscribe to our newsletter
Exclusive high quality content about effective visual
communication in science.