In science, visual communication is fundamental. A lot depends on the subject matter, from an atom to a gene to a crystal or even an entire galaxy. It aims to illuminate knowledge with visuals. Hence, to share discoveries, ideas, and observations, researchers have used both images and text to communicate.
In other words, art contributes greatly to advancements in science and how knowledge is spread. Science and art are often seen as opposites, yet scientific illustration lies at the intersection of the two fields.
You have probably seen numerous scientific illustrations even if you were unfamiliar with the discipline. Take a look at your science books, a museum exhibit you experienced, or even that chart in the doctor’s office displaying the outlines of various body parts.
We have so much more information on that in this article. Learn everything you need to know about scientific illustrations and their crucial role in science.
What is Scientific Illustration?
Scientific illustration is a method of communication that allows complex ideas, details, and theories to be presented in an interesting and informative approach.
It is possible to more clearly communicate scientific concepts through illustrations rather than the technical jargon often used to describe them. Drawing or rendering scientific images accurately is how these artists or illustrators communicate science and inform audiences.
In order to create accurate illustrations, scientific illustrators use a combination of aesthetics and technical expertise. By using illustrations, graphics, and multimedia, concepts can be clearly presented and portrayed visually, making them more accessible and appealing to a wide range of audiences.
By using it, users can explain complex concepts to a wider audience, as well as educate doctors or scientists through exemplary illustrations or animations. After all, the power of pictures cannot be understated.
A Brief History
From prehistoric times, humans have depicted the world around them through art. Cave paintings from Paleolithic times illustrating animals are evidence of this long-established practice.
Chauvet cave paintings in Southern France are a good example of Paleolithic natural illustration. It is estimated that the cave was painted approximately 33000 to 30000 years ago.
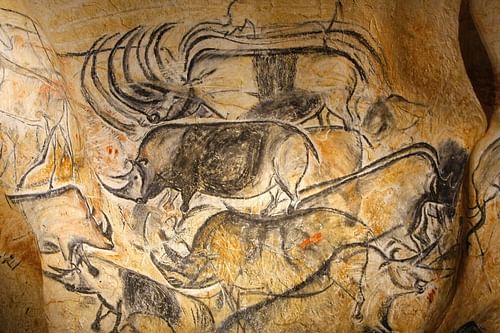
Back in 1994, a group of hikers discovered the cave. Throughout the world, Paleolithic carvings of animals have been discovered in caves, ranging from Bhimbetka, India (lions, bison, and paintings) to Ubirr, Australia (kangaroo-themed paintings).
Historically, illustrations have served to document discoveries and inform others. An illustration from more than fifteen thousand years later depicted a mammoth with a heart-shaped smudge on its shoulder: the smudge was situated close to the heart.
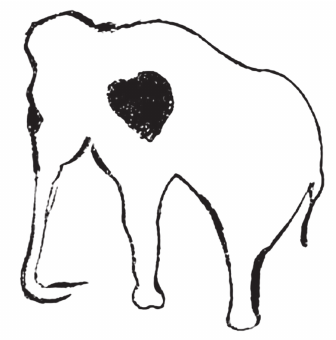
Perhaps this is the oldest example of an anthropological illustration. It has been hypothesized that the illustration may have been a way to guide early hunters on where the mammoth’s heart was located during the hunt.
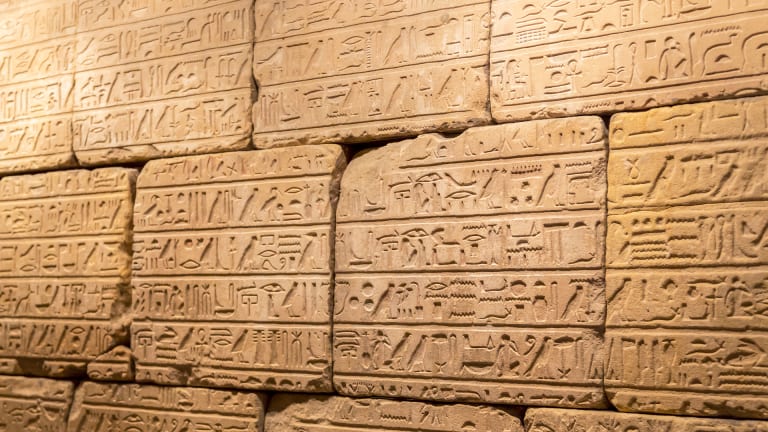
Only centuries later did scholars at Alexandria city in Egypt created a dedicated library for observing. Greek physician Herophilus, who practiced in Alexandria, dissected and drew his subjects to better understand the anatomy of the body. A pioneer in using illustration as a technical tool, he is credited as being one of the first.
Illustrations were crucial to the nascent development of science. Early on in human history, from Greece and Egypt to the Enlightenment in Europe, visual representations were essential for conveying information that was sometimes complex. Illustrations of great artwork were also found on the walls of pyramids.
Until the early 1800s, we had to use scientific illustrations to share visual information. Illustration still holds a lot of power today, even with cell phones and cameras at our disposal. A picture can only portray one perspective at a time; an illustration can depict many.
With the skills of a scientific illustrator, one can illustrate complex designs with multiple lines of focus, draw attention to details, or reassemble disassembled objects in a way that’s impossible with a camera.
Taking a look at galleries of scientific illustrations from centuries past, you will discover intricate illustrations that seem bizarre and perfect at the same time. Scientists often depict more than just a single specimen in their scientific illustrations. Nevertheless, scientific illustrations have become more precise and clearer with the advancement of innovations and technology.
Various Types of Scientific Illustrations
Natural History Illustrations and Mappings
It goes without saying, this is an illustration of historic scientific theories and observations. The collection includes illustrations of creatures, plants, and microbes in their environment. Many of the oldest illustrations in science were in this field since it is heavily observation-based.
It is through their work that illustrators present illustrations of past and present subjects as a way to better understand and study certain natural phenomena. The facts about fossils, animal habitats, and life on the planet can be seen or communicated through these pieces. Several of the older ones include maps and illustrations of the habitat.
Restoration and Illustration of Extinct Species
Although more specific than natural history illustration, this is similar. There are many illustrations of dinosaurs and other extinct species in collections, including wooly mammoths and saber-toothed tigers.
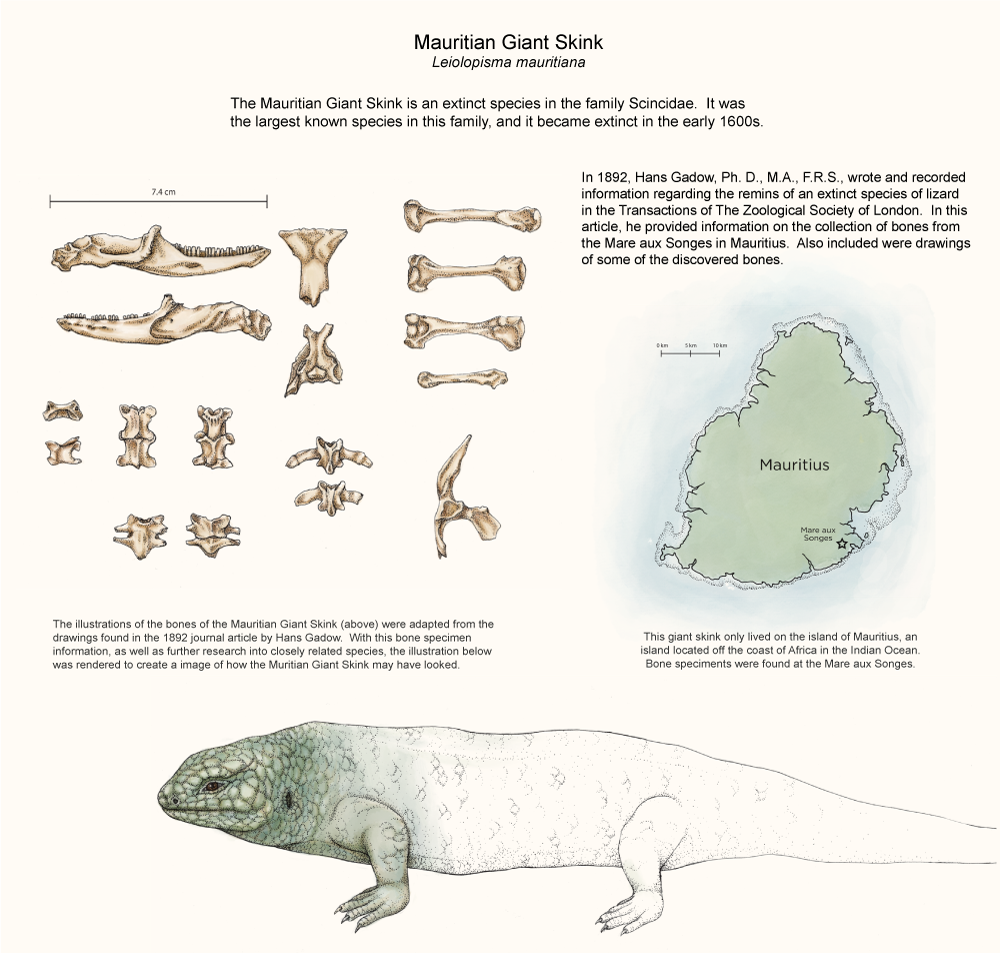
The artwork you see today were made with the help of scientists and fossil evidence found thousands of years after these creatures went extinct. In addition to these popular extinct species, a number of lesser-known extinct species also exist, which some illustrators explore in order to illustrate extinct species.
The Forensic Reconstruction of Facial Structures
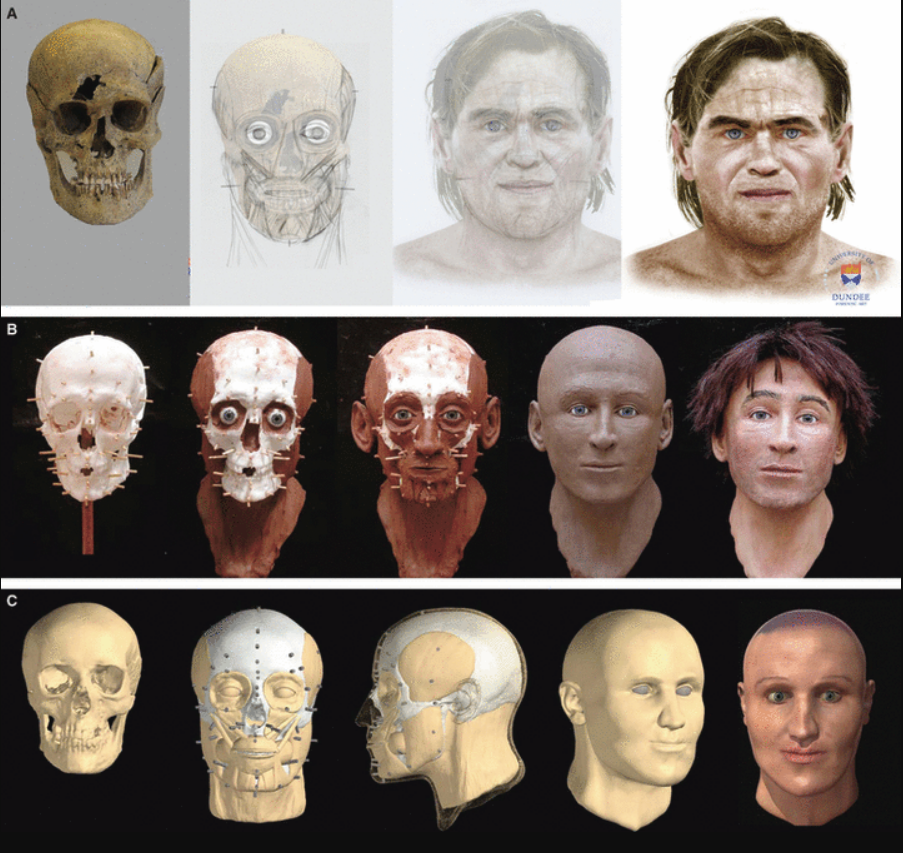
In a similar way to our previous illustration, this one is also more focused. An anthropological reconstruction of the face using a skull or bones from our early hominid ancestors as a basis for this type of illustration. As a result, we are able to get a sense of who our ancestors were, as well as learn about them.
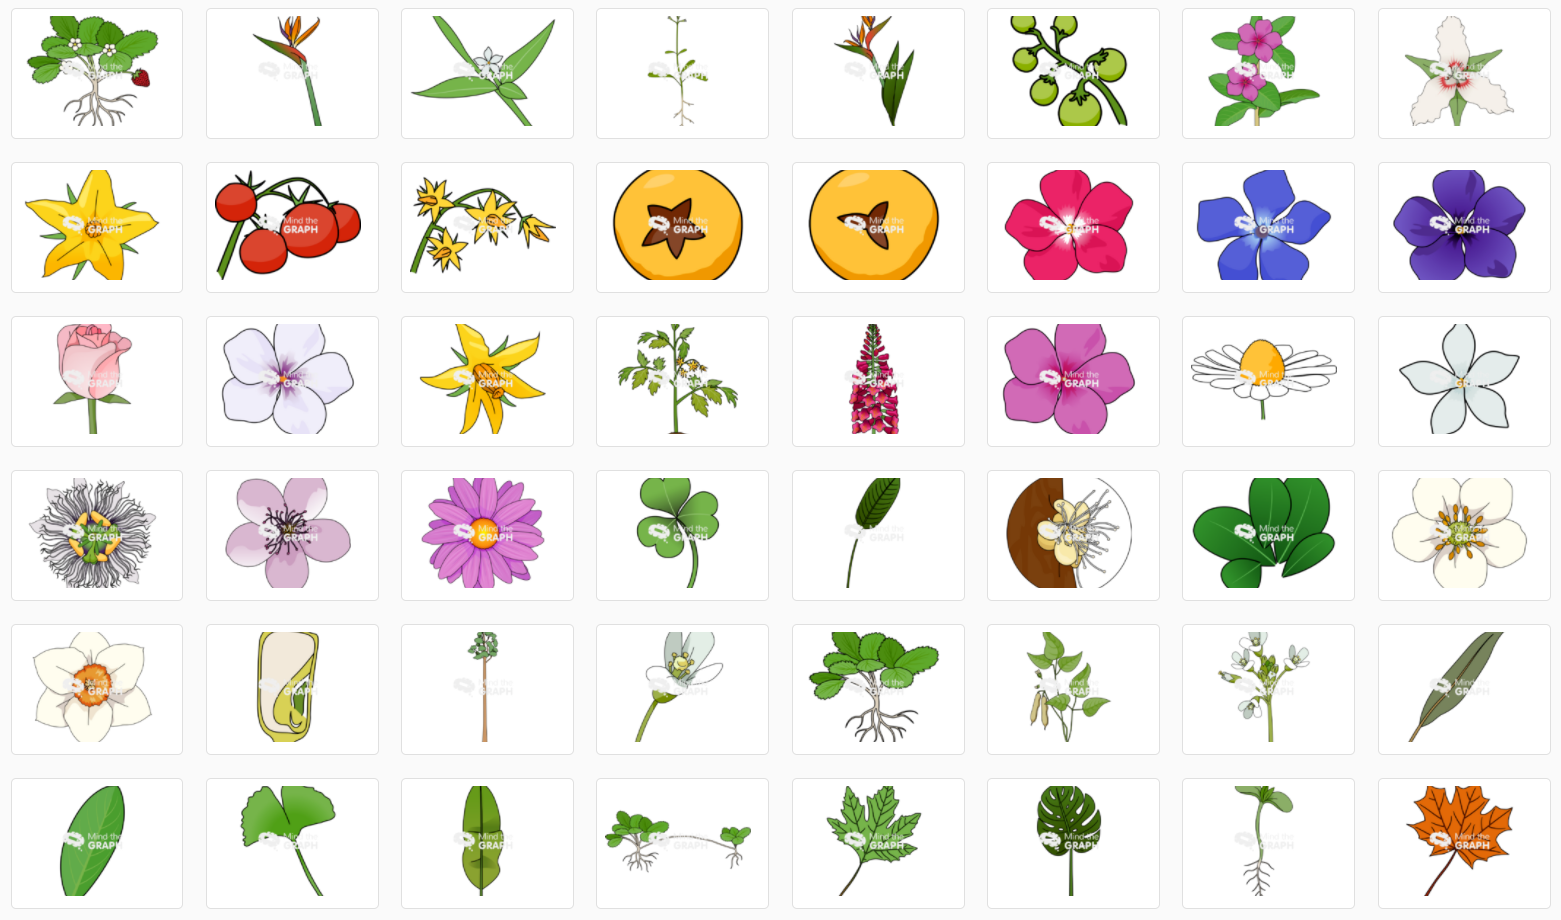
Botanical Illustrations
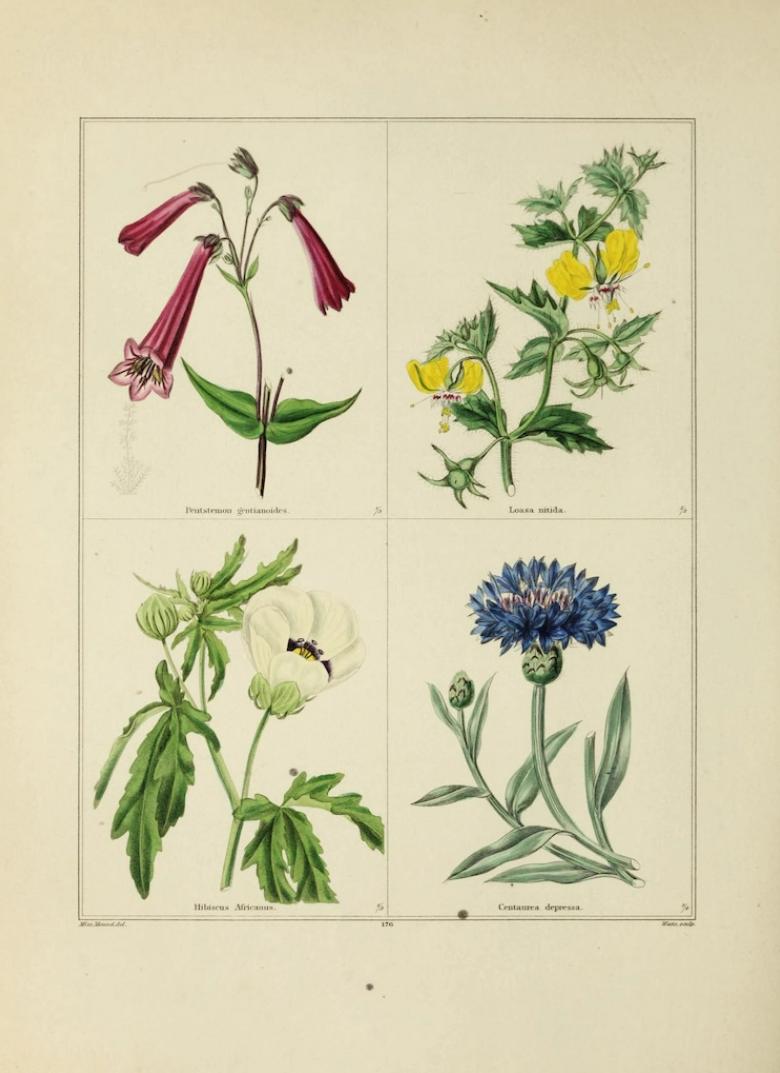
Natural history illustrations often depict botanical subjects and their anatomical characteristics. It is always interesting to illustrate new subjects because there are so many plant species and discoveries. Illustrations in this section detail the entire process of how the plant performs, as well as its unique features.
Models and Images for Museum Exhibits
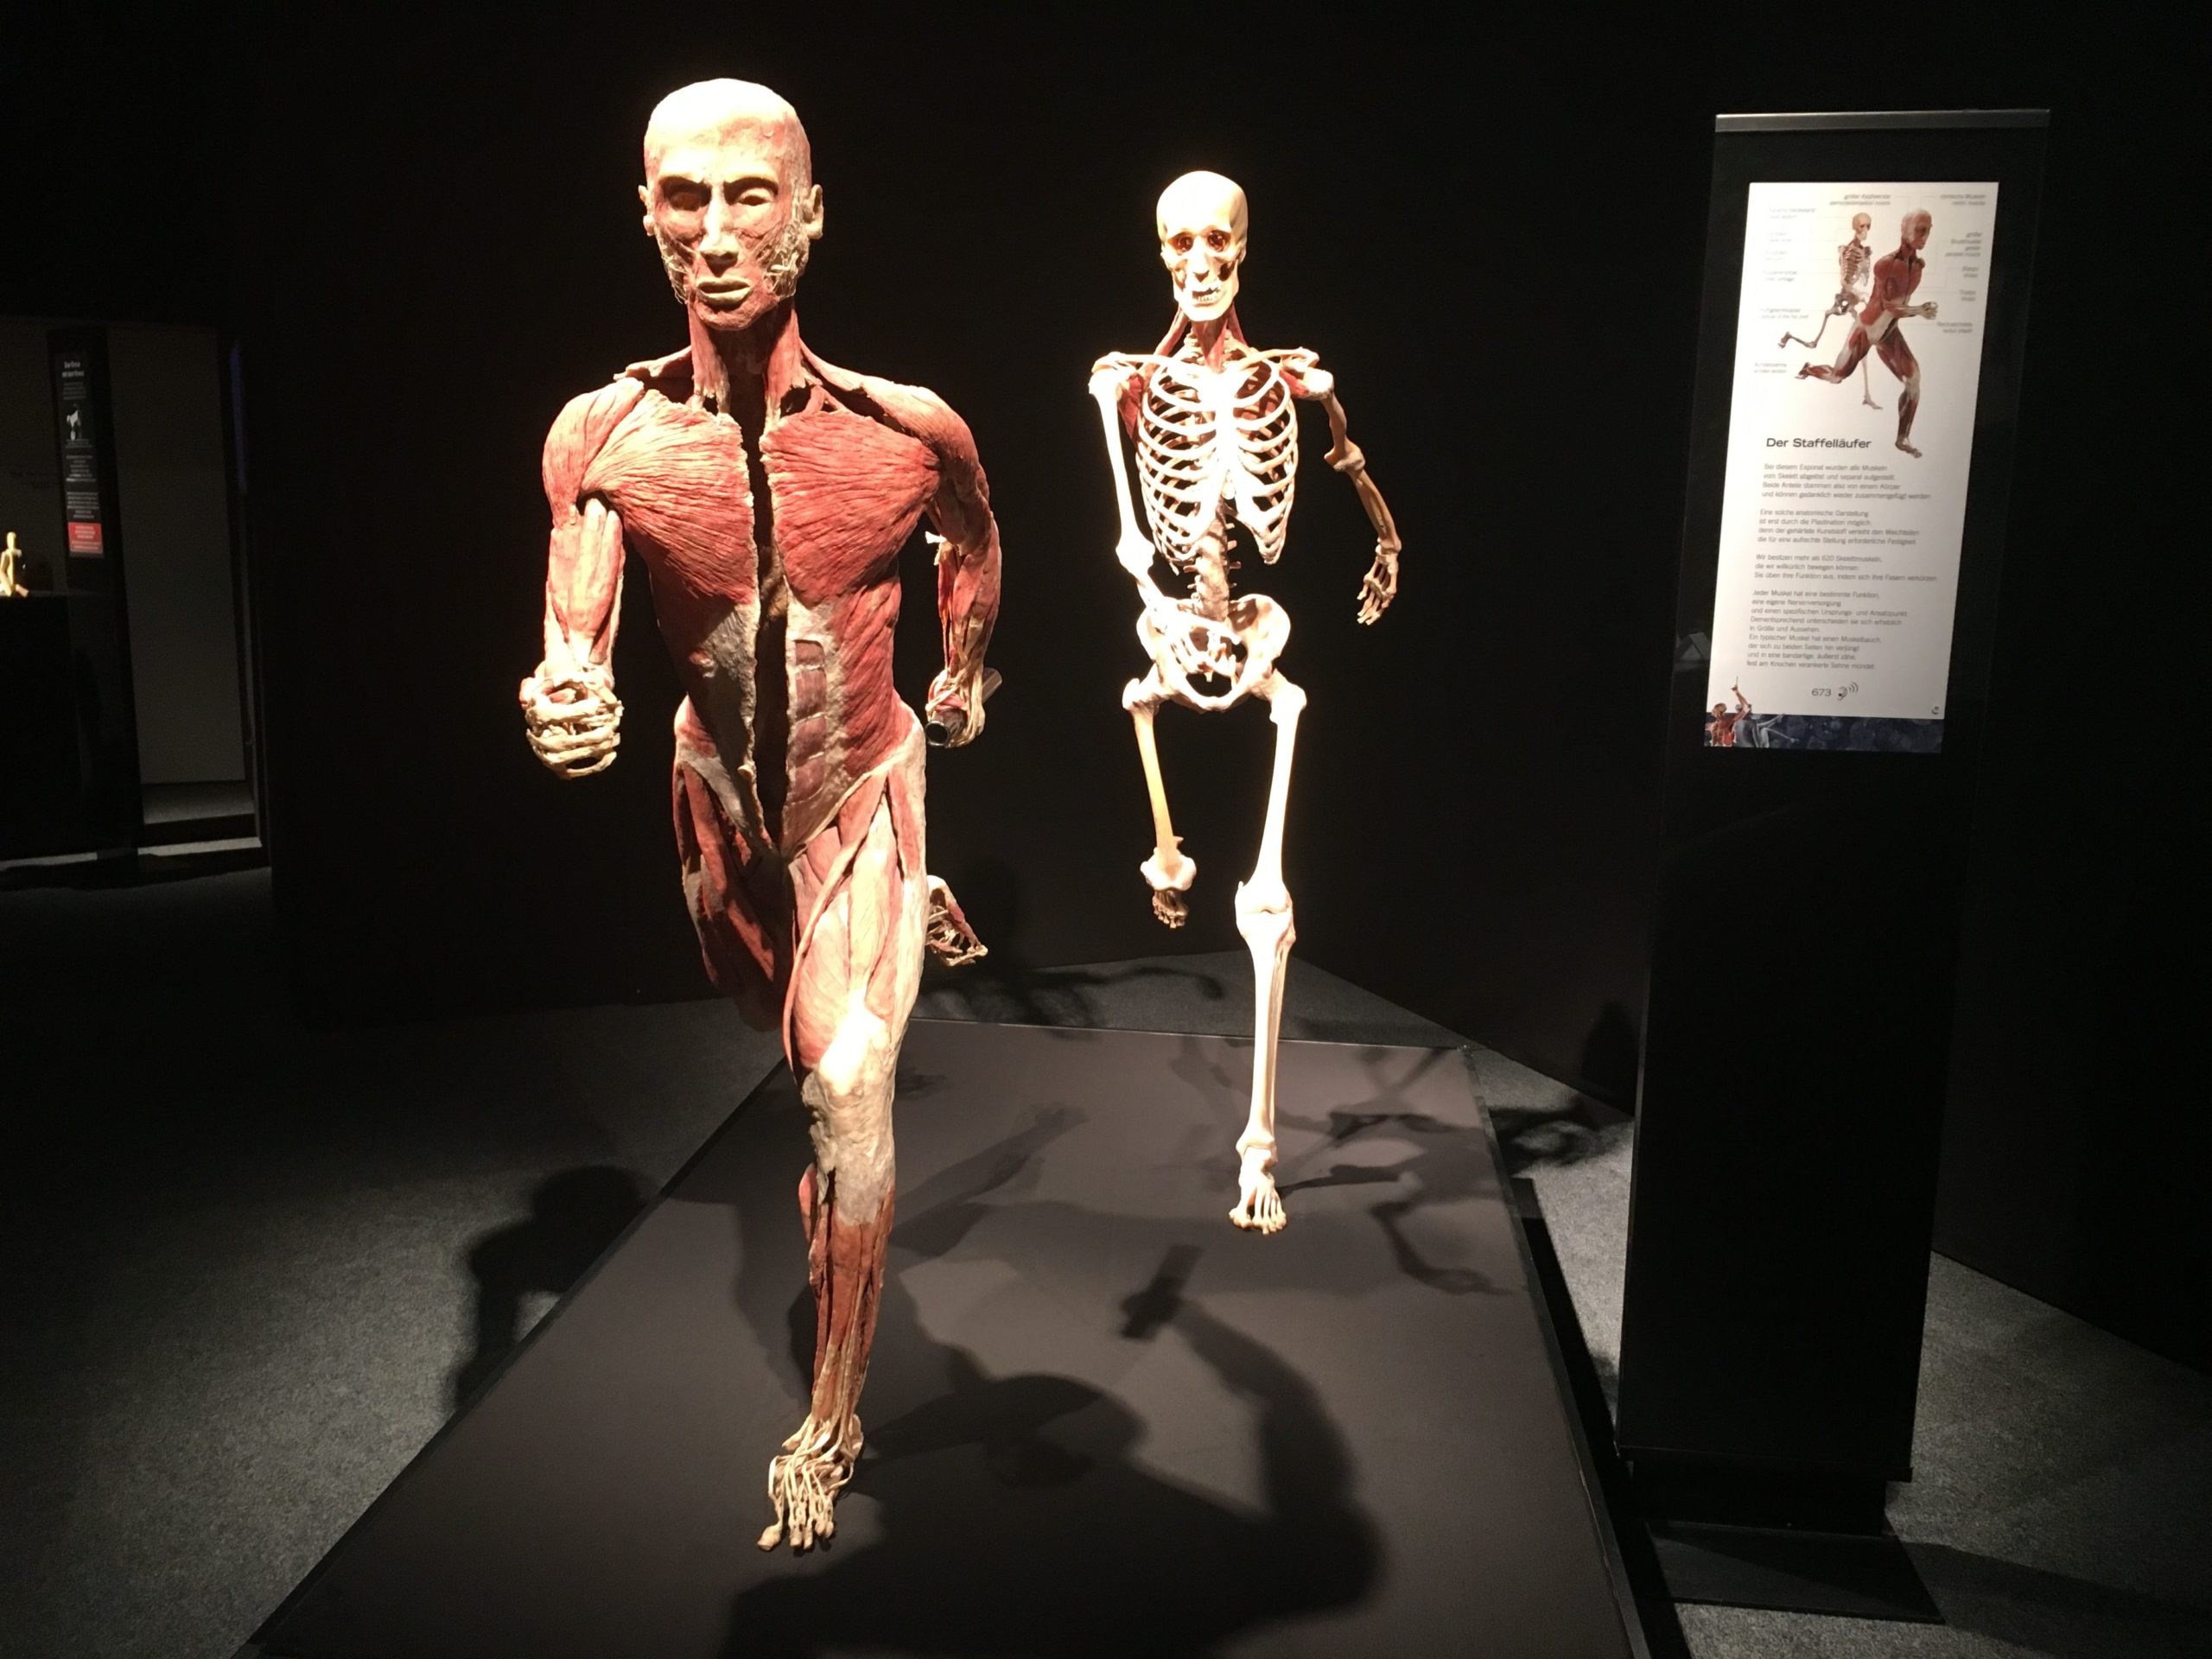
The artistic creation of exhibitions for museums contributes greatly to the educational purposes of scientific art. Content varies widely between exhibits, ranging from interactive exhibits including fossils to text-based exhibits. Since the public can easily comprehend the content, these serve a large part of public education.
Infographics
The creation of functional art is heavily influenced by data and information. As a visual artist, it is important to select relevant and precise data that can be portrayed in a comprehensible and aesthetically pleasing fashion.
Frequently, you can find infographics, such as those made in Mind the Graph’s Infographic Maker, in newspapers, on websites, and even on your mobile device. Depending on the complexity of the design, it could be used for scientific research or for everyday use by the general public.
Digital 3-D models, Animations & Videos
3D modeling and animation have gained in popularity with the advancement of technology. With it, you can model the organism, processes, plants, and animals in their entirety rather than just visually.
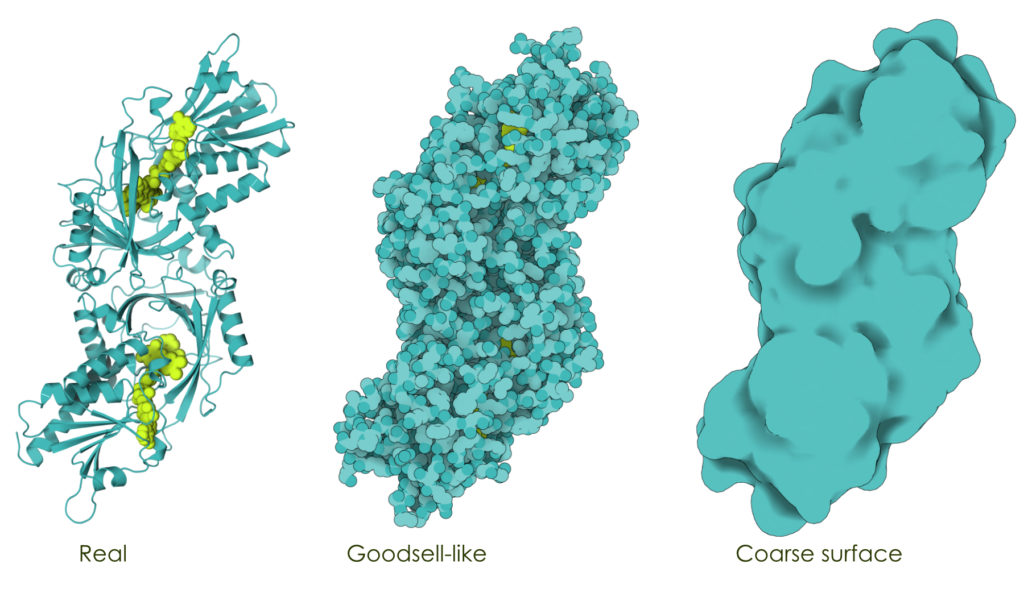
The user can interact with the subject and see how body parts work, as well as how it looks from different perspectives. Processes can be demonstrated, and working models can also be made at a smaller scale to show how it works.
Examples of Scientific Illustrations in Practice
Modern scientific illustrations are undeniably very distinctive from cave paintings. Throughout history, the methods of depicting nature have evolved, from primitive art and engravings to digital art, data graphics, and photographs. Scientists’ illustrations have evolved in line with the advancement of technology and the evolution of science itself. Take a look at some examples.
Botanical Scientific Illustration Examples
Some of the most famous science illustrators have worked on natural history illustrations, which depict observations of plant and insect life.
During the 16th and 17th centuries, European naturalists ventured to South America, Australia, and the Galápagos Islands to gather and examine the natural world.
As the ‘New World’ came to be known, a greater number of illustrations documented its newly discovered environment. Scientist and illustrator Maria Sibylla Merian illustrated many plants and insects. It was she who studied metamorphosis and explained the relationship between organisms and the host plant.
Animals’ Scientific Illustrations Examples
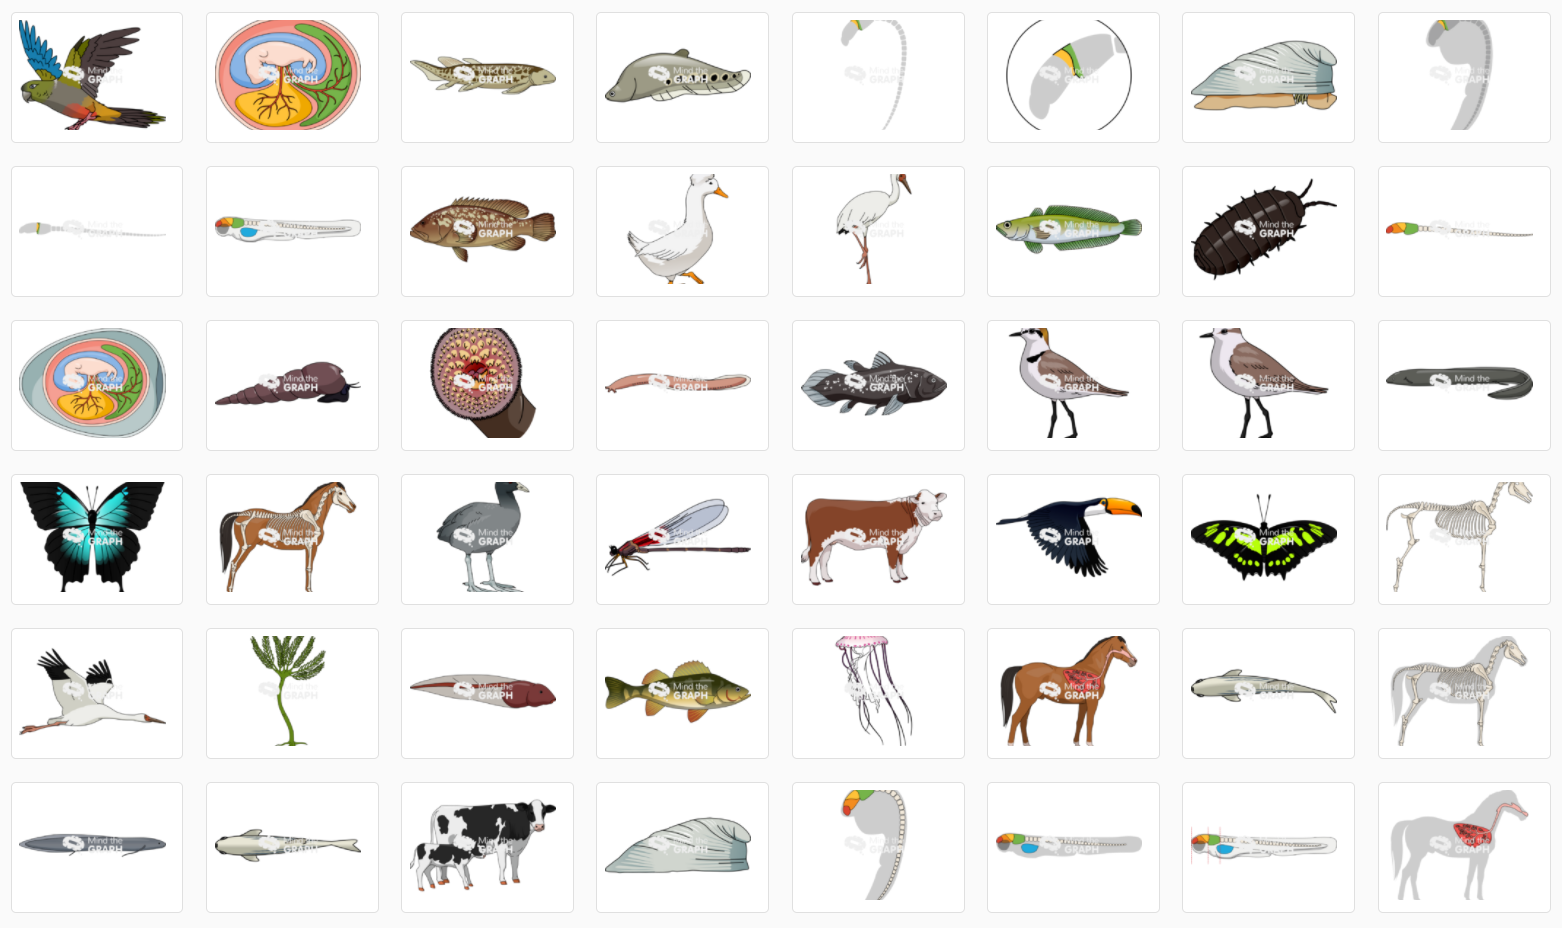
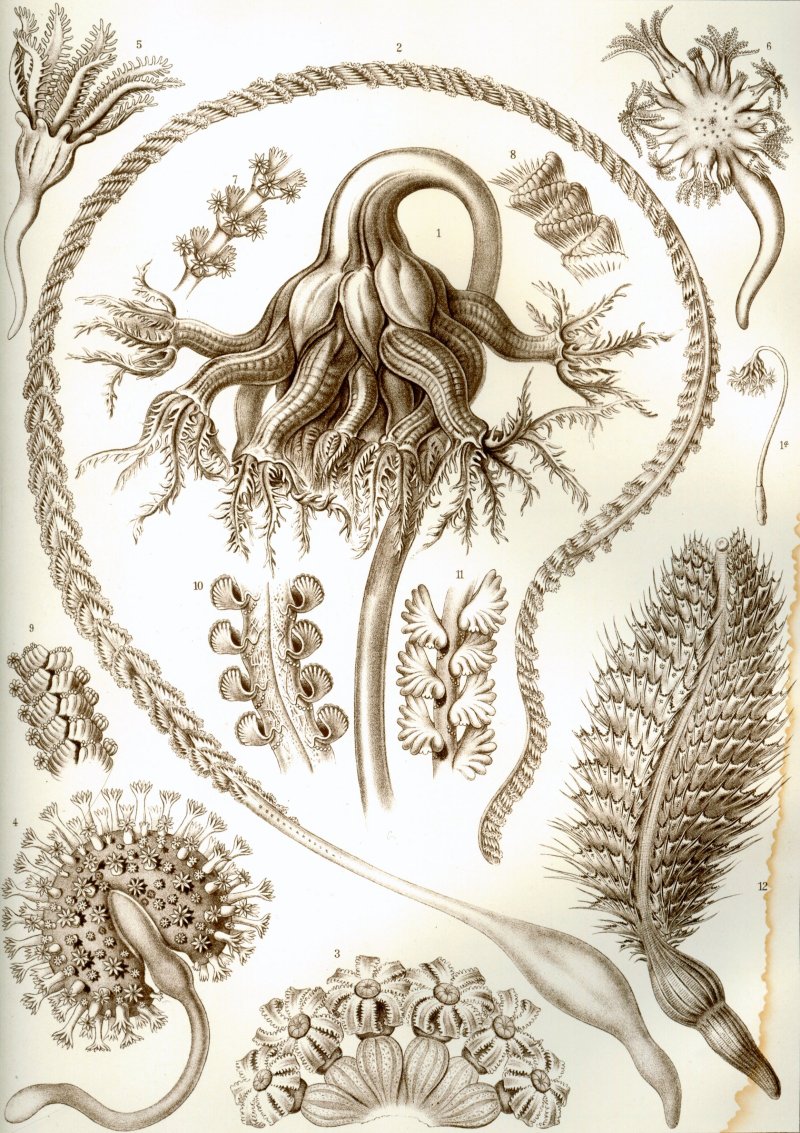
Ernst Haeckel was a zoologist who focused on nature’s symmetry and natural beauty, which helped redefine scientific illustrations. The images he drew helped define modern scientific illustration.
In fact, they still appear in science books and had a profound influence on the arts and architecture of the 20th century. Additionally, he proposed a classification system based on evolutionary history for the kingdom he named “Protista” and discovered a variety of new species within it.
His work paved the way for terms such as phylum, phylogeny, and ecology that have become commonplace in biology. Throughout his life, he was fascinated by the origin of non-random forms, which led him to create Kunstformen der Natur, an illustrated book of life forms.
Medical Scientific Illustration Examples
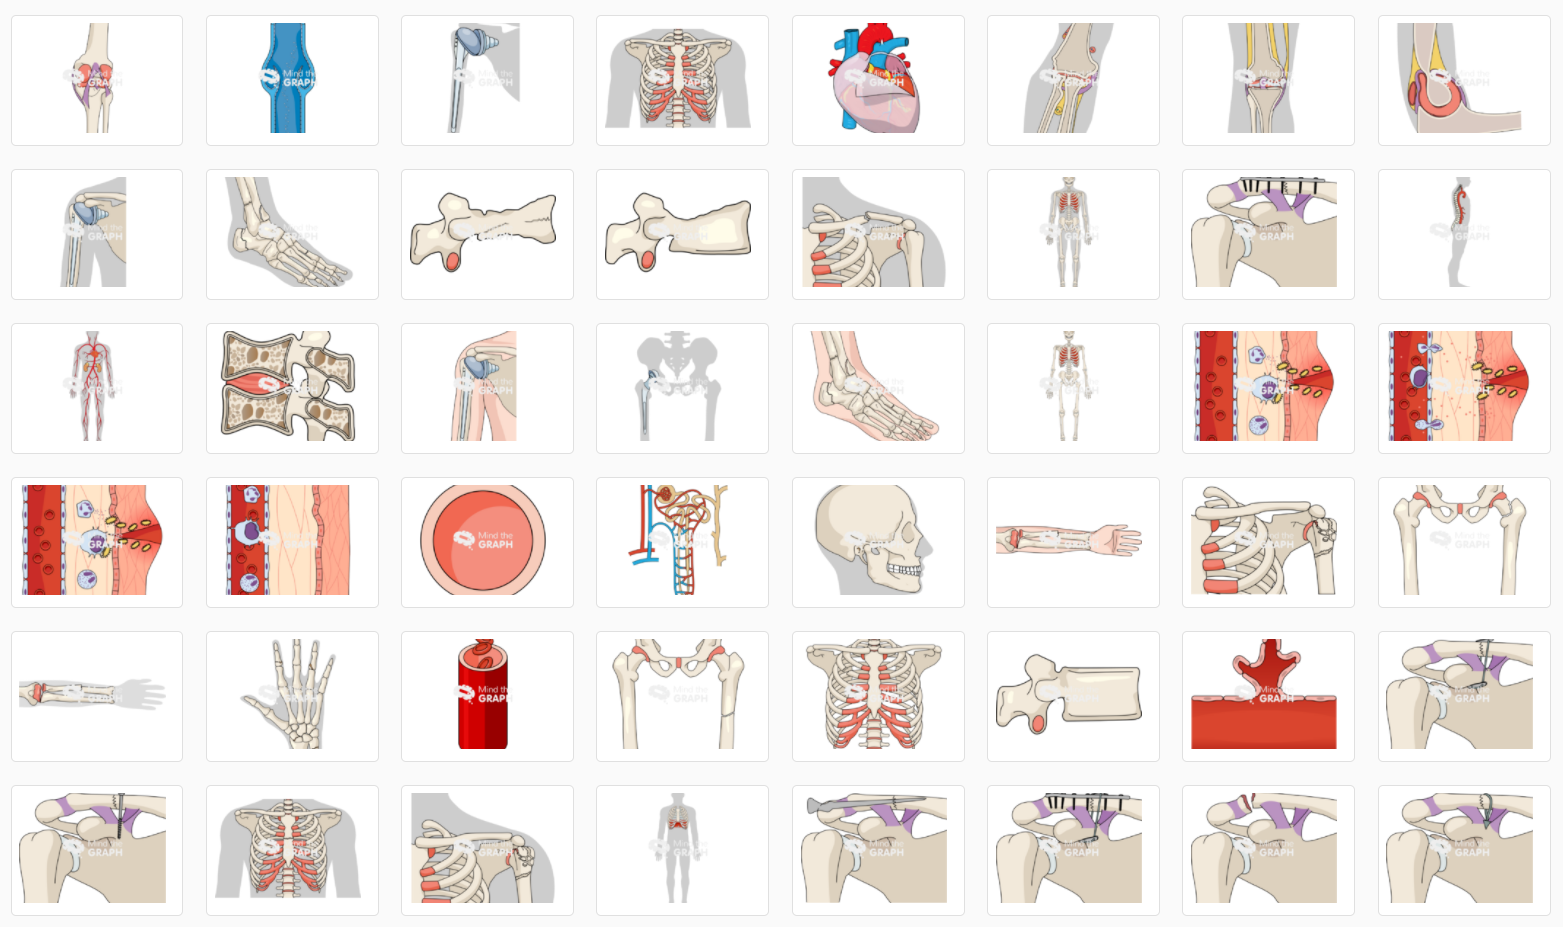
Leonardo Da Vinci illustrated the human heart (around 1511-1513). While Da Vinci is best known for his paintings, he was also an avid stargazer, a skilled architect, a skilled weapons designer, and a serious researcher of human anatomy and botany during his illustrious career.
He found that the heart has four chambers as opposed to two chambers, and most importantly, observed how the aortic valve opens and closes, so blood can only flow one way. Da Vinci’s illustration, now part of the Royal Collection, has survived in remarkably good condition.
How to Make a Scientific Illustration

1. The importance of research is immeasurable
After you’ve chosen a topic for a new research, it’s time to start it. Scientific illustrators begin by researching the topic. It is only possible to create a good illustration if you have a clear vision of what you are trying to illustrate and recognize how important it is.
In the end, sharing accurate information can take a long time, but it’s crucial. Illustrators need to conduct research on the topic and the surroundings around their focal point in order to produce high-quality illustrations.
2. An initial sketch
There will be a lot of roughness in initial sketches. Almost every piece of art goes through rough sketching and conceptual stages before it finally comes to fruition, no matter what the expectation may be. Embrace the process! In order to accomplish a work of art, you will have to revise and edit it for a long time.
3. Experiment with selected tools
Depending on the medium employed by the illustrator, it is essential for them to practice using the tool selected (for example, pen and ink, illustrating software, 3D software, etc.) in order to achieve visual effects and to perfect their technique.
Consider using a drawing tablet and digital brushes in Adobe Photoshop before settling on Adobe Illustrator. But if you need easy smooth illustrations, think about Mind the Graph, a platform made specially for scientific art projects with the world’s largest gallery of scientific illustrations to work from.
4. Decide on the composition & transfer drawings
It depends on what type of media is used, but typically in conventional drawing or painting, the finished composition or outline is transferred onto the surface. To transfer a sketch, tracing paper must be used. Light boxes can be used by illustrators to expedite the transfer process.
Over the original sketch is placed the paper for the final illustration, allowing light to shine through for tracing a final illustration into the paper. Digital illustrations work a bit differently from traditional sketches. The majority of the work is done through software, so it can be done easily and cleanly.
With Mind the Graph’s tool, you may edit composition freely with many assets and customizable elements to achieve the intended goal.
5. Finish the final illustration
This step, although seemingly simple, takes a lot of time. During the process of creating the final scientific illustration, an illustrator must continually reevaluate the content, layout, design, and appearance of the product.
You can use reference images to illustrate various subjects realistically and to observe how lighting and positions influence a subject’s appearance. The inclusion of a scale and measurements is also prevalent in scientific illustrations, depending on the domain or content.
Creating a Science Figure with Mind the Graph
Common Mistakes to Avoid
Mistakes with scientific illustrations arise from confusing them with naturalistic drawings, or even extremely realistic drawings. There is a great debate among professionals in illustration over the limit of these disciplines.
While there are semantic debates over the meaning of each branch, there are certain points where there is a degree of consensus.
Avoid Subjectiveness
Making an illustration has a tendency to be subjective, which is one of the most common errors discussed in this area. The main problem can be found in the overly subjective approach of the author, who mixes up the work’s informative function and its personal interpretation.
Don’t Let Aesthetics Overtake
Scientists, researchers, museums, editors, and journalists use scientific illustrations to explain something. Illustrations of scientific information are not created by themselves or by their authors. Therefore, valuing aesthetics over functionality is a grave mistake. Scientific illustrations must be both accurate and visually appealing.
One mistake that is often made is giving excessive weight to the exactitude of certain features of the image and overlooking the synthesis of the message. There are times when an illustration acquires a work of art status more than that of a scientific illustration due to its interdisciplinary aspects, thus compromising the scientific information instead of other aesthetic considerations.
Also, Don’t Do the Opposite
The opposite difficulty occurs when too much attention is paid to scientific veracity and not enough to aesthetic aspects. One can find works that are very useful for academic research, but not necessarily for informational purposes, which is yet another of the various uses for scientific illustrations.
Attention to Details
Additionally, errors are made in scientific illustration because of a low degree of consistency in color, pattern, and format, incoherence between concepts and designs, disregard for discipline-specific codes, inconsistent proportions and angles, the use of difficult-to-understand words and symbols, and the absence of graphs with accurate scales.
So, it’s important to do thorough research on the subject, understand it, and then begin illustrating it. If you want an easier path to achieve that, try creating from a ready-to-use template that provides the ideal layout for you to enhance. You may find a nice gallery of scientific templates to edit from in Mind the Graph.
Today, scientists have at their disposal a variety of visualization tools, with each contributing to science communication in different ways. The use of macro-and microphotographs, as well as images derived from scientific data, is an integral part of scientific practice because they are objective and convey knowledge about a subject.
Illustrations, however, can also obscure the bigger picture by focusing on in-depth details. As in textbooks and scientific journals, illustrations simplify complex systems so that audiences can grasp scientific concepts. Illustrations’ artistic quality and creative quality increase reader interest in scientific texts and make science more approachable for everyone.
If you seek inspiration for scientific illustration, you must check the world’s largest scientific illustrations gallery, where you can choose from many categories to use in creations. Moreover, as a Mind the Graph user, you can also request specific custom illustrations from a team of illustration experts.


Subscribe to our newsletter
Exclusive high quality content about effective visual
communication in science.