Research infographics are a powerful tool for effectively visually communicating scientific findings. This particular method of presenting information combines the use of data, illustrations, and concise text to convey complex research findings in a clear and engaging format. With the rise of digital platforms and tools like Mind the Graph, scientists and researchers now have access to user-friendly online platforms specifically designed to create visually appealing scientific figures, infographics, graphical abstracts, presentations, and posters. These platforms aim to address the challenge many researchers face in visualizing complex scientific data without requiring specialized design skills. By making scientific communication more accessible and visually engaging, research infographics have the potential to enhance the dissemination of scientific knowledge across a wide range of audiences within the scientific community.
Unraveling the Power of Research Infographics
Decoding: What is a Research Infographic?
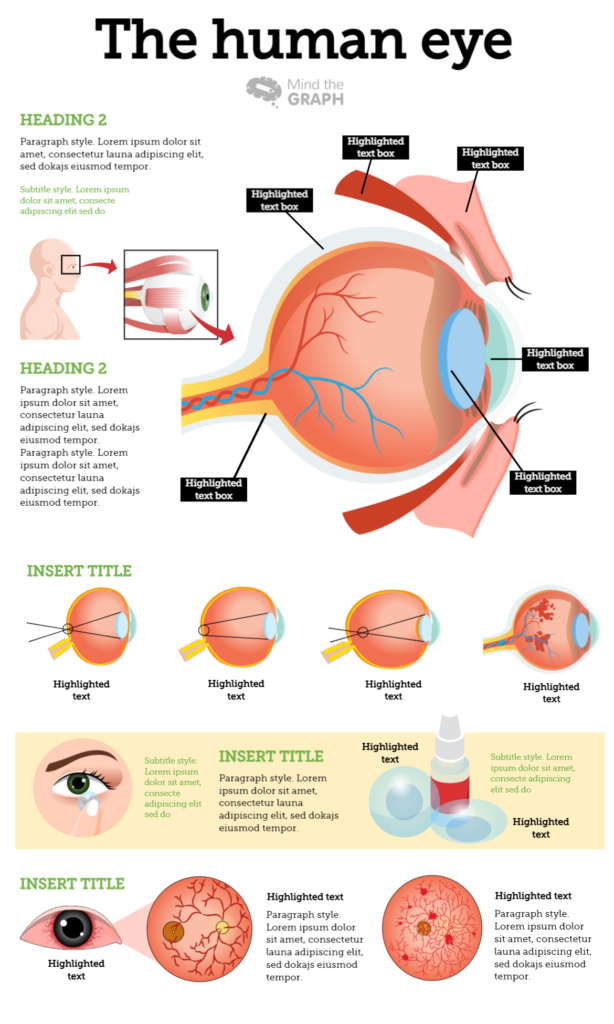
A research infographic is a visual representation of scientific data and information. It is a powerful tool that combines text, data, and design elements to present complex scientific research findings in an easily digestible format. Infographics can include charts, diagrams, and other visual elements to illustrate the data and key points from the research paper. A well-designed research infographic is not only aesthetically pleasing but also enhances comprehension and recall of the information presented. In essence, research infographics serve as a bridge between dense scientific data and a broad audience spectrum, making scientific knowledge more accessible and understandable.
The Importance of Visual Communication in Science
Visual communication plays a crucial role in the field of science. As the old saying goes, “a picture is worth a thousand, as few words are.” This is particularly true in scientific research, where complex data and findings need to be communicated effectively. Visual aids like infographics, charts, and diagrams can help break down these complex data sets and theories into more understandable formats. They can highlight key points, show relationships and patterns, and provide a clearer view of the research findings. Moreover, visual communication can significantly enhance the engagement of the audience as it is generally more appealing and easier to digest than text-heavy content. By presenting data visually, scientists and researchers can reach a broader audience, making science more accessible to the public. In conclusion, visual communication, especially through research infographics, is a vital tool in bridging the gap between scientific research and understanding.
How Infographics Simplify Scientific Data Interpretation
The beauty of infographics lies in their ability to simplify the interpretation of scientific data. They turn complex research findings into visual stories that are easy to understand. The strategic use of colors, shapes, and lines in an infographic can highlight trends, show comparisons, and illustrate processes that would be challenging to interpret in a traditional data table or text description. By visually representing data, infographics allow researchers to convey complex scientific findings in a way that is easily digestible for a broad audience. This is particularly beneficial when explaining intricate concepts or large data sets, as it allows the viewer to see the big picture without getting bogged down in details. Furthermore, the use of infographics can make the data more memorable, as people are generally better at remembering information presented visually. In conclusion, infographics act as a powerful tool in making science less intimidating and more accessible to the general public.
The Making of Excellent Research Infographics
Exploring the Interface of Mind the Graph
Mind the Graph is an online platform designed for creating visually appealing infographics for scientific research. The interface is user-friendly, making it accessible for both beginners and professionals. Once you’ve logged in, you’re presented with a blank canvas on which you can start creating your infographic. There are thousands of scientifically accurate illustrations and templates to choose from, covering a wide range of scientific fields. You can easily drag and drop these elements onto your canvas and customize them according to your needs. The platform also allows you to import your data and transform it into various chart types. The interface provides the flexibility to adjust colors, sizes, and positions of elements to create an infographic that best represents your own research project. Furthermore, Mind the Graph has an interactive tutorial and a help center to guide users in creating their infographics. In summary, Mind the Graph offers a user-friendly and versatile platform for researchers looking to visually communicate their scientific findings.
Advantages of Using MindTheGraph for Researchers
Mind the Graph offers numerous advantages for researchers aiming to create visually appealing scientific infographics. The platform is designed for non-designers, making it ideal for scientists and researchers who may not have specialized design skills. With thousands of scientifically accurate illustrations available, researchers can easily find visuals related to their specific field of study. The ease of customization allows researchers to tailor their infographics to best fit their data and findings. Additionally, the platform’s ability to directly import data and convert it into various chart forms simplifies the process of creating data-driven visuals. The availability of various free infographic templates also fast-tracks the creation process, saving valuable time for researchers. Importantly, MindTheGraph offers a platform for researchers to share their infographics with a wider audience, thus enhancing the visibility of their work. It is not only a tool for creating infographics, but it is also a community of scientists and researchers committed to making scientific knowledge more accessible and engaging through visual communication.
Customizable Scientific Figures: A Revolution in Research
The ability to customize scientific figures has revolutionized the way research findings are presented and understood. Customizable scientific figures allow researchers to visually represent their data and findings in a way that best aligns with their message. This level of customization can significantly enhance the clarity and comprehensibility of the research being presented. With platforms like MindTheGraph, researchers have the flexibility to choose from a wide array of scientifically accurate illustrations and adjust the size, color, and placement of stock images according to their needs. This not only makes the infographics more aesthetically pleasing but also enhances their effectiveness in communicating complex scientific information. Additionally, customizable scientific figures allow researchers to emphasize key points, highlight trends, and draw attention to important data, thus making their research more impactful. Overall, the use of customizable scientific figures has transformed scientific communication, making it more engaging and accessible for a wide range of audiences.
Linking Research Infographics to Better Understanding
How Infographics Enhance Scientific Communication

Infographics have the power to transform scientific communication by making complex research findings accessible and understandable to a wide audience. They offer a visually engaging format to present scientific data, making the content more appealing and easier to digest. By representing data visually, infographics can highlight key points, show patterns and relationships, and provide a clearer understanding of the research findings. The strategic use of colors, shapes, and lines can help guide the viewer’s attention and emphasize important information. Furthermore, infographics can simplify complex concepts and theories, making them more relatable and understandable. They also make scientific communication more memorable, as humans are generally better at recalling information presented visually. Finally, infographics can reach a broader audience, including those without a scientific background, thereby expanding the reach of scientific research. In conclusion, infographics are not just tools for data visualization, they are powerful means of enhancing scientific communication.
Accessibility: Simplifying Complex Data with Infographics
One of the key advantages of using infographics in scientific research is their ability to simplify complex data and make it more accessible. Infographics use visual cues like color, size, and position to indicate relationships and patterns in the data. This can make it easier for the viewer to understand the data and grasp the core findings of the research. Infographics can break down complex concepts and large data sets into manageable chunks, allowing the viewer to see the big picture without getting overwhelmed by details. This is particularly important in scientific research, where data can be complex and dense. By simplifying complex data, infographics can make scientific research more accessible to a wider audience. This includes not just other researchers, but also policymakers, journalists, and the general public. In this way, infographics can help to democratize scientific research, making it more inclusive and accessible to all.
Infographics in Action: Real-world Applications
Case Studies: Successful Usage of Research Infographics
Research infographics have proven successful in using data gathered a variety of fields and contexts. For instance, in the field of public health, infographics have been used to effectively communicate complex epidemiological data during public health crises. One notable example is during the COVID-19 pandemic, where infographics played a crucial role in communicating data on infection rates, mortality rates, and virus spread patterns to the general public.
Another successful application of research infographics can be seen in environmental science. Researchers have used infographics to present data on climate change, biodiversity loss, and other environmental issues in a way that is visually appealing and easy for readers to understand. These infographics have helped to raise public awareness and understanding of these issues.
In the field of education, research infographics have been used to present data on student performance, education disparities, and other key issues. These infographics have helped policymakers, educators, and parents to better understand these issues and make informed decisions.
These case studies highlight the power of research infographics in communicating complex data and enhancing understanding across a range of fields and contexts.
Infographics Beyond Just Pictures: Conveying Powerful Stories
Infographics are more than just visually appealing pictures and graphs. They are powerful storytelling tools that can help convey the narrative behind scientific research. When designed effectively, infographics can take viewers on a journey, guiding them through the research process, highlighting key findings, and explaining their implications.
For instance, an infographic on climate change can tell a compelling story about the rise in global temperatures, the consequences of this increase, and the urgent need for action. Similarly, an infographic on a medical study can visually narrate the process of the research, from hypothesis formulation, through data collection and analysis, to the eventual findings and their implications for healthcare.
By presenting data as a story, infographics can evoke emotions and create a stronger connection between the viewer and the subject matter. This can make the research more memorable and impactful, and can spur viewers to action. In this way, infographics go beyond just conveying data – they can convey powerful stories and images that can inform, inspire, and influence.
Maximizing the Impact of Research Infographics
Tips to Design Astounding Research Infographics
Designing an effective research infographic involves more than just choosing attractive visuals and layouts. Here are some tips to create infographics that are not only visually appealing but also effective in communicating your research:
- Start with a clear goal: Before you start designing, have a clear understanding of what you want to achieve with your infographic. Are you aiming to explain a complex process, show a trend, or compare data sets?
- Keep it simple: Don’t overload your infographic with too much information. Stick to the essential data and keep the design clean and uncluttered.
- Use visuals strategically: Use visuals such as charts, diagrams, and illustrations to represent data and concepts. Use colors, shapes, and sizes to highlight key points and indicate relationships.
- Make it easy to follow: Organize your infographic in a way that guides the viewer’s eye through the information. Use directional cues like arrows or lines to guide the viewer.
- Include a call to action: End your infographic with a call to action, such as a suggestion for further reading or a question to encourage engagement.
With these tips, you can create research infographics and graphics that effectively communicate your findings and engage your audience.
Search Engine Optimization: Incorporating SEO in Infographics Design

Search Engine Optimization (SEO) is an important aspect to consider when creating research infographics. Incorporating SEO practices can enhance the visibility of your market research infographic, online, therefore reaching a wider audience. Here are some tips for incorporating SEO in your infographics design:
- Use relevant keywords: Identify the keywords related to your research topic and include them in the title, description, and alt text of your infographic. This can help search engines understand the content of your infographic and rank it accordingly.
- Create high-quality content: Search engines prioritize high-quality, original content. Make sure your infographic provides valuable information that is relevant to your target audience.
- Optimize file size: Large file sizes can slow down page load times, which can negatively impact your search engine ranking. Compress your infographic to an optimal file size without compromising its quality.
- Promote sharing: Encourage viewers to share your infographic on social media and other platforms. This can generate backlinks to your site, which can boost your search engine ranking.
By incorporating SEO practices in your website and infographics design, you can maximize the reach and impact of your scientific research.
Looking Ahead: The Future of Research Infographics & Its Potential
New Horizons: Evolving Trends in Scientific Infographics
The field of scientific infographics is continuously evolving, shaped by advancements in technology and changing audience preferences. Here are some trends that are expected to shape the future of scientific infographics:
- Interactivity: With the proliferation of digital platforms, we can expect to see a rise in interactive infographics. These infographics allow the viewer to interact with the data, for example, by zooming in on specific data points or viewing different scenarios.
- Data personalization: As data becomes increasingly available, there is potential for creating personalized infographics that cater to the specific interests or needs of the viewer.
- Augmented and Virtual Reality: AR and VR technologies open up new possibilities for presenting data in 3D or even immersive environments, enhancing viewer engagement and understanding.
- AI and Machine Learning: AI and ML technologies can automate the process of creating infographics, making it easier and faster to visualize large datasets.
These trends point to a future where scientific infographics become even more engaging, personalized, and accessible, thereby further enhancing the communication and understanding of key messages of scientific research.
A Shift in Communication: The Increasing Demand for Visual Data
As we move further into the digital age, the demand for visual data is increasing. This shift is driven by a growing recognition of the power of visuals in enhancing understanding and engagement. People are inherently visual creatures, and research shows that we process visual information much faster than text. Moreover, visuals, such as icons such as those found in infographics, are more likely to be remembered and shared, thus increasing the reach and impact of the information.
In the context of scientific research, this shift towards visual communication is particularly important. Scientific data can be complex and challenging to comprehend. By presenting this data visually, researchers can make their findings more accessible, understandable, and appealing to a broader audience. This shift is not just about making data look pretty; it’s about enhancing the communication and understanding of scientific research.
As the demand for visual data continues to grow, we can expect to see an increasing use of research infographics in scientific communication. This trend underscores the importance of visual literacy and image-using skills for researchers in the digital age.
Subscribe to Mind the Graph and start creating your research infographic in minutes
Mind the Graph is the perfect tool for you to start creating your research infographic. Start by selecting a template and customize everything (colors, content, fonts, figures, etc.) After the customization, start by reviewing all details and then export the creation to PNG, PDF or TIFF and done! Now you’re ready to create your research infographic and conquer the academia with stunning visuals. Subscribe now!


Subscribe to our newsletter
Exclusive high quality content about effective visual
communication in science.