Are you a scientist or researcher looking to create a research poster that will grab attention and make an impact? Look no further – in this ultimate guide, we will walk you through the steps to make a research poster that stands out. Whether you’re a beginner or a seasoned professional, Mind the Graph.com is an online platform designed to help you create visually appealing scientific figures, infographics, graphical abstracts, presentations, and posters. With its user-friendly interface and access to over 75,000 scientifically accurate illustrations in 80+ fields, Mind the Graph makes it easy for researchers to communicate their complex data in a visually engaging way. Say goodbye to the challenge of visualizing your research without specialized design skills – Mind the Graph is here to revolutionize scientific communication.
Understanding Research Posters
Importance of Research Posters
In the world of scientific research, research posters play a crucial role. They are a popular medium for the presentation of scientific findings at scientific conferences, seminars, and symposia. Research posters provide a snapshot of your work, enabling fellow researchers, students, and the general public to understand the scope, methods, results, and implications of your research.
Moreover, research posters allow for interactive communication. Presenters get the opportunity to discuss their work one-on-one with interested viewers, explain complex concepts, generate discussion, and receive instant feedback. This interactive nature of poster presentations fosters scientific dialogue and collaboration.
Importantly, a well-designed research poster can attract attention and create a lasting impression on conference attendees. With so many posters on display at scientific gatherings, having a standout research poster is critical. It’s not just about presenting your research—it’s about making your research memorable.
What Constitutes a Good Research Poster?
A good research poster is a careful balance of content and design. It succinctly presents the results section your research in a visually appealing and easy-to-read format. Here are the key elements of how to make a research poster:
- Clarity: Your poster should concisely convey your research objective, methods, results, and conclusions. Avoid overly technical jargon and ensure your content is accessible to a broad audience.
- Structure: Your poster should have a logical flow. The layout should guide the viewer from the introduction and objectives, through the methods and results, to the conclusions and implications.
- Visual Appeal: Use figures, graphs, and diagrams to illustrate your points. These visuals should be simple yet informative, helping viewers understand your research at a glance.
- Readability: Choose fonts and colors that are easy on the eyes. Ensure there is sufficient contrast between the text and the background.
- Engagement: Aim to stimulate conversation. Pose thought-provoking questions or highlight surprising findings to draw in viewers and spark discussions.
Remember, the aim is not to cram as much information as possible onto the white space of the paper or poster. It’s about communicating your research effectively and engagingly.
Creating a Standout Research Poster
Essential Elements of a Research Poster

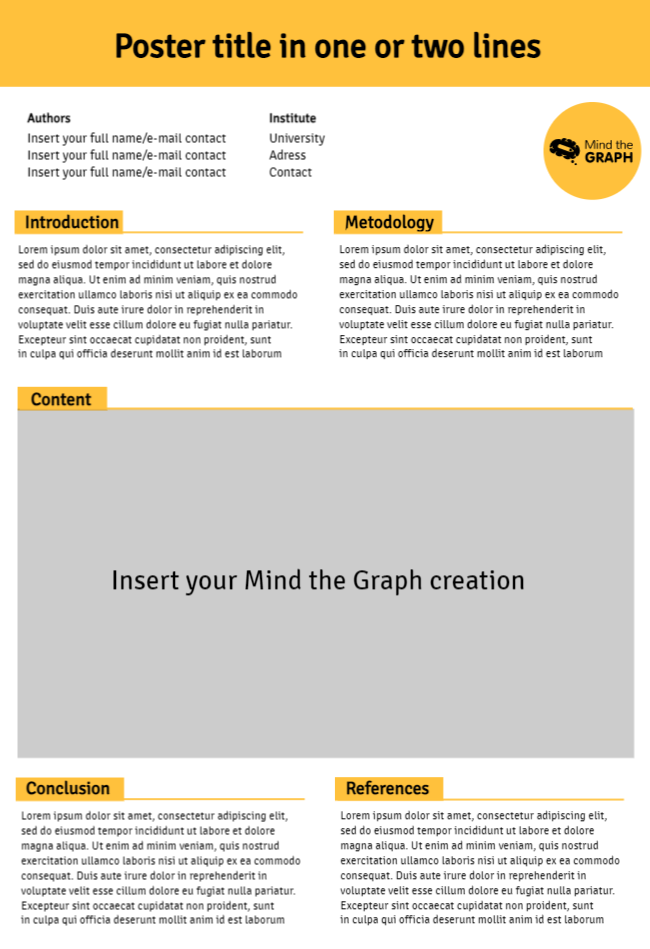
Creating a standout research poster involves incorporating several essential elements into your design:
- Title: Your title should be brief yet informative, clearly indicating the focus of your research. It’s the first thing viewers see, so make it captivating.
- Authors and Affiliations: List the names of all authors involved in the research and their respective affiliations. The lead author’s name is typically listed first.
- Introduction/Objectives: This section provides a context for your research, outlines your research question, and states your objectives.
- Methods: Describe your research design and the methods you used to collect and analyze data. Be succinct but clear.
- Results: Present your findings using clear and concise text, supplemented by graphs, charts, or images.
- Conclusions: Summarize the key findings and their implications. What does your research mean in the larger context?
- References: Cite any sources or research that informed your study.
- Acknowledgments: Recognize those who assisted in your research or funded your study.
- Contact Information: Include your email or other contact information for viewers who wish to follow up.
Remember, simplicity is key. Your poster’s content layout should be visually engaging, but not cluttered or overwhelming.
Designing with Mind the Graph
Designing a research poster can be a daunting task, especially if you don’t have a background in graphic design. That’s where Mind the Graph comes in. This online platform offers a user-friendly interface and a vast library of scientifically accurate illustrations, making it easy for researchers to create visually engaging scientific posters themselves.
To start, choose from a variety of pre-designed templates or create your own design from scratch. Then, drag and drop your desired illustrations onto your poster. With over 40,000 illustrations in 80+ fields, you’re sure to find images that perfectly represent your own research project.
Next, add your text. Mind the Graph allows you to customize the font, size, and color, ensuring your text complements your visuals and is easy to read.
Finally, use the platform’s tools to arrange your content in a logical, visually pleasing manner. You can easily adjust the size and position of each element, ensuring a balanced layout.
With Mind the Graph, you don’t need to be a design expert to create a professional, eye-catching research poster.
Making Use of Mind the Graph
Navigating the Mind the Graph Platform

Navigating the Mind the Graph platform is straightforward, even for beginners. Here’s a simple guide to help you get started:
First, sign up for a free account on the Mind the Graph website. Once logged in, you’ll be directed to the dashboard. From here, you can create a new project, view your saved projects, or explore the platform’s vast library of scientific illustrations.
To create a new research poster, click on the “New Infographic” button. You’ll be prompted to choose a template. Mind the Graph offers a variety of templates tailored to different scientific fields and presentation types.
Once you’ve selected a template, you’ll be taken to the editor. Here, you can add text, change fonts and colors, and insert illustrations. The platform’s drag-and-drop interface makes it easy to add and rearrange elements on your poster.
On the left-hand side, you’ll find the tools menu. Here, you can access more design options, such as shapes, lines, and backgrounds.
Remember, the Mind the Graph team is always ready to assist if you have any questions or need help navigating the platform.
Utilizing Scientific Illustrations
Scientific illustrations are a powerful tool for visualizing complex research data. Mind the Graph offers a wealth of scientifically accurate illustrations to enhance your research poster.
To access the illustrations library, navigate to the “Illustrations” tab in the editor. Here, you can browse through over 40,000 illustrations in 80+ fields. You can search for specific illustrations using the search bar at the top or filter by categories.
Once you’ve found an illustration you’d like to use, simply click on it and drag it onto your poster. You can resize and reposition the print, entire poster or illustration as needed.
Using illustrations can help break up text-heavy sections well-designed posters, making your poster more engaging and easier to digest. They can also help to highlight key points, demonstrate processes, and represent results visually.
Remember, while illustrations can greatly enhance your poster, they should not be overly complex or confusing. The goal of visual representation is to aid understanding, not to complicate it. Use illustrations judiciously and ensure they directly support your research message.
Advantages of Using Mind the Graph
Using Mind the Graph to create your research poster has several key advantages.
Firstly, it democratizes great poster design for scientists and researchers. With its user-friendly interface, you don’t need to be a graphic design expert to create a professional-looking scientific poster either.
Secondly, it offers a vast library of scientifically accurate illustrations good poster make. This resource saves you the time and effort of creating visuals from scratch and ensures your poster is both visually appealing and scientifically sound.
Thirdly, it’s customizable. You can easily adjust the font, color, size, and positioning of every element on your poster, ensuring your poster design aligns with your research and personal style.
Lastly, it’s efficient. With Mind the Graph, you can create a poster in less time than it would take using traditional design software. Plus, with the ability to save and edit your project, you can work on your poster at your own pace.
In short, Mind the Graph equips you with the tools to effectively communicate your research in a visually engaging way.
Finalizing Your Research Poster
Reviewing Your Research Poster
Once you’ve completed your initial design, it’s essential to take the time to review your research poster thoroughly. Here are some points to consider:
- Clarity: Is your message clear and concise? Does your poster effectively communicate your research objective, methods, results, and conclusions?
- Flow: Check the logical progression of your content. Can viewers easily follow the flow from the introduction to the conclusion?
- Visuals: Review your illustrations and charts. Do they accurately represent your data and enhance understanding?
- Typography: Check your text for readability. Is the font size large enough? Is there sufficient contrast between the text and the background?
- Errors: Proofread your text for any spelling, grammar, or punctuation errors. Also, check your data for any inaccuracies.
- Feedback: Consider getting feedback from colleagues or mentors. They can provide a fresh perspective and may spot errors or areas for improvement that you might have missed.
Remember, a little extra time spent reviewing and refining your poster can make a significant difference in the poster display final outcome. It’s worth the effort.
Making Your Research Poster Accessible
Accessibility should be a priority when finalizing your research poster. Ensuring your effective poster presentation is accessible to all viewers, regardless of their ability, is not just ethical – it enhances the reach and impact of your research.
Here are some simple ways to make your poster more accessible:
- Color Contrast: Use colors that contrast well to ensure your text and illustrations are clear and distinguishable. Avoid using color as the only means of conveying important information, as this can be problematic for viewers with color vision deficiencies.
- Font Size: Use a large, easy-to-read font size. This not only helps viewers with visual impairments but also makes your poster easier to read from a distance.
- Clear Language: Use clear, concise language and avoid unnecessary jargon. This makes your research accessible to viewers from different backgrounds and knowledge levels.
- Captioning: Provide captions or alternative text for images and diagrams. This helps viewers with visual impairments understand the content of your visuals.
- Layout: Arrange the elements of your poster in a logical, linear order. This helps viewers with cognitive impairments follow your content more easily.
Remember, an accessible academic poster, is an effective poster. Make sure the poster title of your research can be appreciated by everyone.
Promoting Your Research Poster with Mind the Graph
Once you’ve created your standout research poster, it’s time to share it with the world. Mind the Graph can aid in promoting your research poster to a wider audience.
Firstly, you can download your poster in a high-resolution format suitable for printing or digital viewing. You can also share a direct link to your online poster or embed it in your website or blog.
Furthermore, Mind the Graph has a continually growing community of scientists and researchers from around the world. Becoming part of this community allows you to share your work, get feedback, and engage in scientific discussions. You can also explore and get inspired by the work of others.
Remember, promoting your research is an integral part of the scientific process. It’s not enough to do good research; you need to communicate it effectively and make it accessible to others. Whether you’re presenting at a conference, a poster session, a seminar, or online, Mind the Graph is here to help you make your research and poster sessions stand out and be seen.
Enhance your research with compelling visuals through Mind the Graph
The Mind the Graph platform provides customizable scientific illustrations, templates, and design tools, empowering scientists to create engaging figures that convey findings effectively. With features for data integration and customization of colors, fonts, and styles, researchers can personalize their visuals to match their unique research style, ensuring broader accessibility and memorability.


Subscribe to our newsletter
Exclusive high quality content about effective visual
communication in science.