In recent years, researchers, grantors, and institutions have become more interested in evaluating the effectiveness of their work. Professionals are having a hard time staying current with the rise in scientific publications.
In conjunction with social networks, it is now more common than ever to share information over the Internet. It is possible to determine which articles are catching the attention of our colleagues through the information displayed on our mobile devices or online. Such metrics provide you with quantitative information that helps you choose which journals to publish your work in and how your research is impacting your field.
It isn’t possible for everyone to read everything that’s available on the internet at the moment. It is very hard to comprehend scholarly research work without filters. Because conventional ones may not provide a better overview, there has been the development of better tools to assist. It’s time now to look at something called Altmetrics, what it is, how it works, and everything you should be familiar with.
What Altmetrics mean?
As you browse an article’s associated website or when you view the frequently cited or most read articles found on a journal’s website, you will see a brightly colored donut with a distinctive number.
Altmetrics is an acronym for alternative metrics, donuts, and scores, and it evaluates the impact of research. Authors of books and journals can use Altmetric to see how much traction their work is receiving online.
Most of the data in this score are drawn from web-based social media feeds, as a complementary measure to conventional, citation-based metrics. This feature keeps you up to date on where articles are being distributed and talked about by different groups because it is updated constantly.
Research impact can be measured with Altmetrics in a number of ways, but the main advantages are: early insights into a published article’s reach and impact, as well as the ability to track progress in recognition over time.
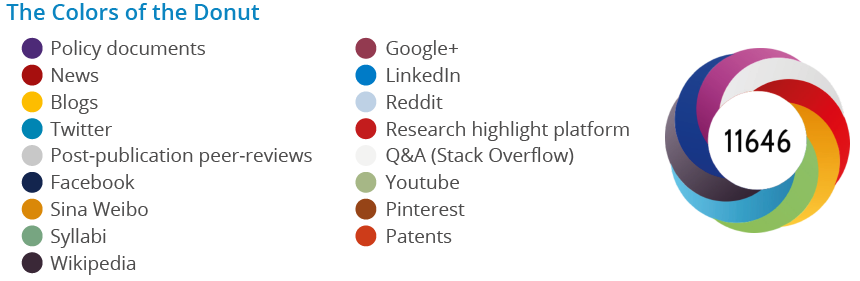
An Altmetric Attention Score for the content being consumed is indicated by the number inside the colored circle. The quantity and quality of attention a piece of work receives are quantified.
Besides allowing you to see where your audience finds your work, it’s also great for monitoring your readership. The badge is colored according to where it has been cited. Depending on the source of publicity received by a research output, the amount of each color will vary. An attribution indicates the source of a reference. Various sources are tracked by Altmetrics:
- Policy documents
- Email listing
- Wikipedia
- News portals
- Social media
- Syllabi
- Peer reviews
How is the Altmetric score calculated?
In Altmetric attention scores, researchers weight scholarly articles according to the attention they have garnered. The determinants that contribute to the Altmetric attention scores include:
- Volume: When the number of people who mention an article goes up, the score will rise as well. However, it only considers one reference per source.
- Sources: The final score is determined by a base amount for each of the mention categories. Using a news article, as an example, will contribute more to the overall score.
- Authors: the frequency with which the author mentions the article and whether they have any partisan orientation. Several accounts may share the same article at the same time.
The score is calculated by an in-built algorithm, which measures the level of attention that Altmetric has determined for a research document. Weights reflect the reach and importance of different sources. A whole number must always be assigned to the Altmetric Attention Score.
Therefore, scores are sometimes rounded up to 1 for mentions that contribute less than 1. Altmetric would increase the score by 1 if it detected one YouTube (0.25 score) post for a book or article, but if it detected three more YouTube posts for that same publication, then the score would still be increased by 1.
What is a good altmetric?
There is no real way to determine if the quality of a score is ‘good’ since it measures attention, and attention can be good or bad. Moreover, there is a difference in the overall score between journals: publications in Science or Nature often score higher than those in lesser-known journals, due to the fact that they are read by more people, which increases their chances of being shared.
It might be possible to receive a good rating in one journal, but a low rating in another. When considering these two factors, an article that scores 20 or above is generally doing much better than its peers.
Can an altmetric score drop?
It is possible that not all articles have Altmetric scores and that some articles have a score that decreases over time. From the final quarter of 2011, Altmetric started collecting data, so scores are calculated on that data. Scores are typically not available for older articles unless they were recently mentioned. The scores of several social media users can increase over time, but they can also decline if they delete posts or their profiles (Deleted YouTube videos, blogs or published articles).
What can I do to make my work more visible?
Altmetric will pick up online mentions of your research as soon as your work gets attention if you have done a few things.
- If you link to your research, make sure to include its unique identifiers, such as DOIs, arXiv IDs, and PubMed IDs.
- Links in headers or other sections of the page cannot be picked up by Altmetric. Instead, they need to be found only in the content itself.
- There is only one instance per person that counts as a citation. You can’t post the same piece of work multiple times as this won’t improve your score.
- In the current age of social media, it is always best to have an easily distributable poster or illustration. Getting attention that way is always easy.
- The source that mentions the work must be tracked by an Altmetric tool. Get help from support to ensure that your sources are tracked.
Now that you’re all set, here are some tips to enhance your work’s visibility.
- You can present the results of your research by posting a summary on relevant mailing lists and online forums.
- Provide statistics, images, illustrations, brochures, and other files for download.
- Contribute to existing blogs or create your own. An online profile will help you position your research and enhance your online presence.
- You can use the Altmetric scores to locate bloggers related to your field and contact them to inform them of your work. Invite them to publish your work, or you can simply collaborate with them.
- Embrace the opportunity to provide links to your work in your email signature, social media profiles, and CV.
- After presenting at conferences, include the conference hashtag in your tweets and other social networking posts.
- Become acquainted with conference attendees through online conversations. Listen to what they have to say about your work.
- Fill out your profile with your ORCID-ID so that others will be able to find you and recognize your work.
- Posters on your research and results should be presented at gatherings more often. Make the posters available online.
A tool made for researchers and scientists
While the qualitative information in Altmetric reports is the most valuable part of the report, a visual approach can be useful for how different research projects stand up against others.
For your content to be more attractive, visual elements can be a good opportunity to generate more interest and subsequently result in wider dissemination of your work. According to a famous study mentioned in The Economist, “Graphic Details: the importance of diagrams to science”, having an infographic as a visual element in the paper increases citations by 120%.
Wondering where this can be accomplished? Mind the Graph offers templates and illustrations for helping scientific dissemination.


Subscribe to our newsletter
Exclusive high quality content about effective visual
communication in science.