
Creating a graphical abstract, infographic or presentation that is visually attractive and scientifically accurate isn’t an easy task. We have a library with thousands of scientific illustrations, mostly of life science to help scientists improve their communication.
However, a beautiful illustration does not fix everything. It needs to be well placed and match the other elements of your creation.
Therefore, in addition to the main illustrations, using our platform you can find several backgrounds, shapes, icons and secondary illustrations. You can use your creativity to try different combinations and choose the best one.
We’ve made a tutorial to help you find the best way to combine backgrounds, shapes and illustrations, to create a landscape. We chose a nature theme, but you can use the tips to create a graphical abstract or infographic about your research field.
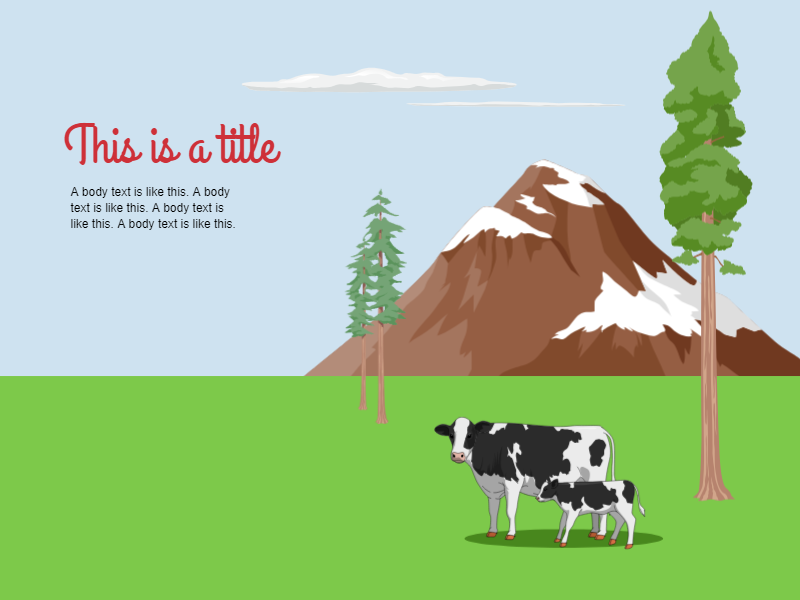
Watch the tutorial video and give free rein to your imagination:
We have a youtube channel with tutorials, tips and graphical abstract examples. Subscribe to watch new videos every week.
If you don’t find the illustration you need, just write to contact@mindthegraph.com and request a new one. We create on demand illustrations to our subscribers. After your request, it takes a few days to your illustration to be ready. You can see all the benefits of being a Mind the Graph subscriber here

Subscribe to our newsletter
Exclusive high quality content about effective visual
communication in science.