#35 Find accurate life science illustrations online
Hi there! As you may know, Friday is the day to share the new scientific […]
Hi there! As you may know, Friday is the day to share the new scientific […]
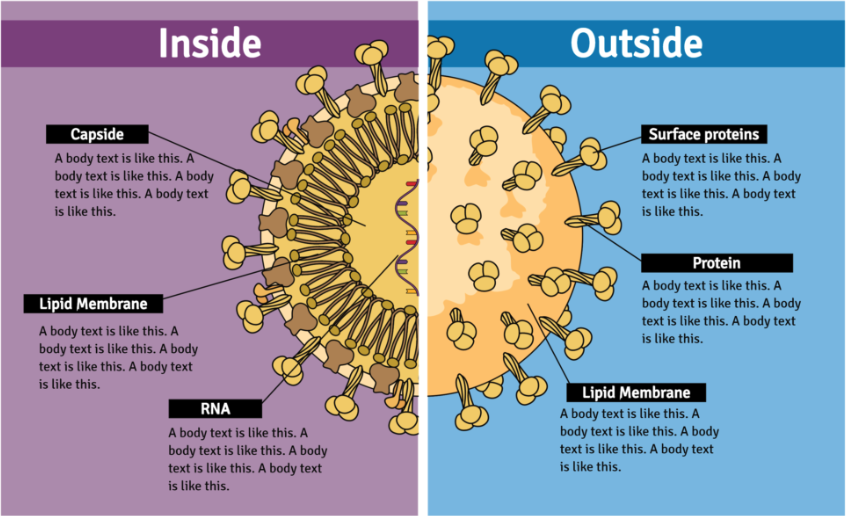
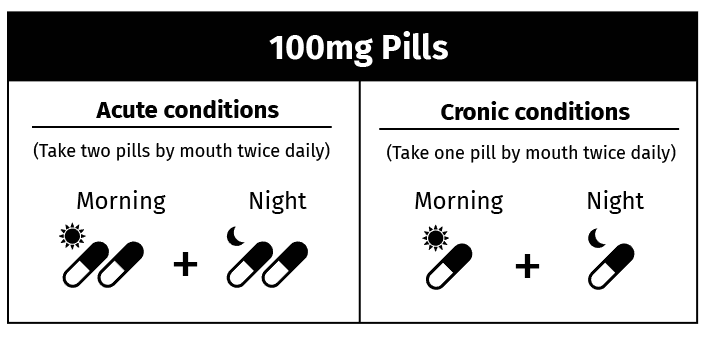
A comparison infographic is a great tool to compare and contrast two or more elements. […]
Hi there! As you may know, friday is the day to share the new scientific […]
This post is about a very serious and important topic. Each year nearly 800,000 people […]
It is common to use two or three different species in a experiment. Besides that, […]
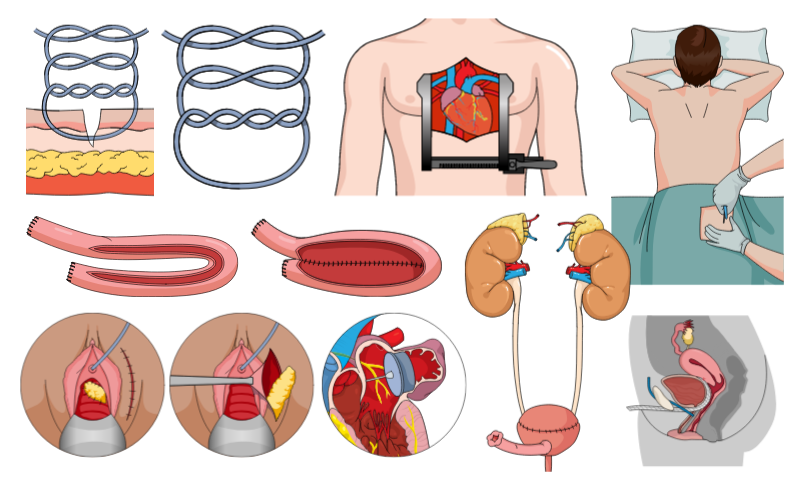
As a doctor, you probably know the importance of communicate well with your patients. They […]
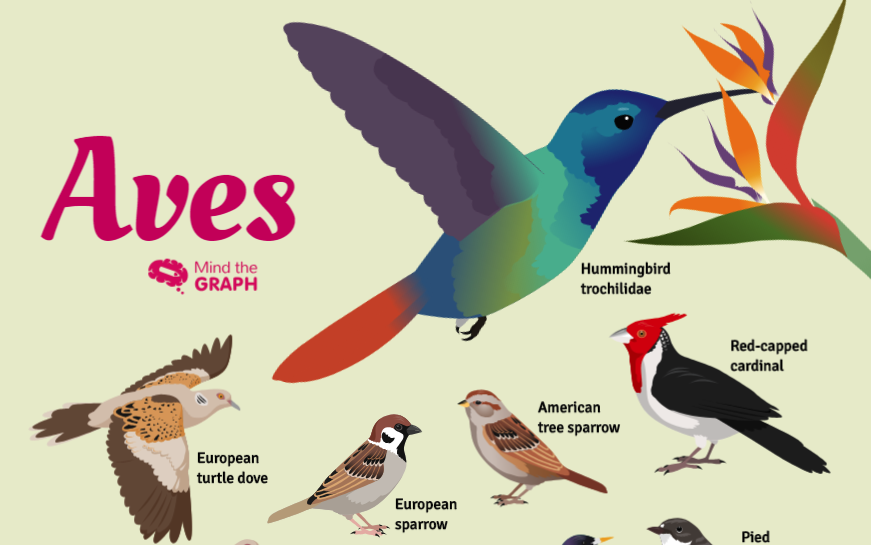
Birds, also known as Aves, are a group of endothermic vertebrates. They are characterised by […]
Mind the Graph Templates If you are a user already, you know that the Mind […]
Improve science communication is important to reach more people and fight against misinformation. Illustrations are a […]
As ilustrações científicas são uma ferramenta poderosa para comunicar em ciência. Como espécie visual, aprendemos […]
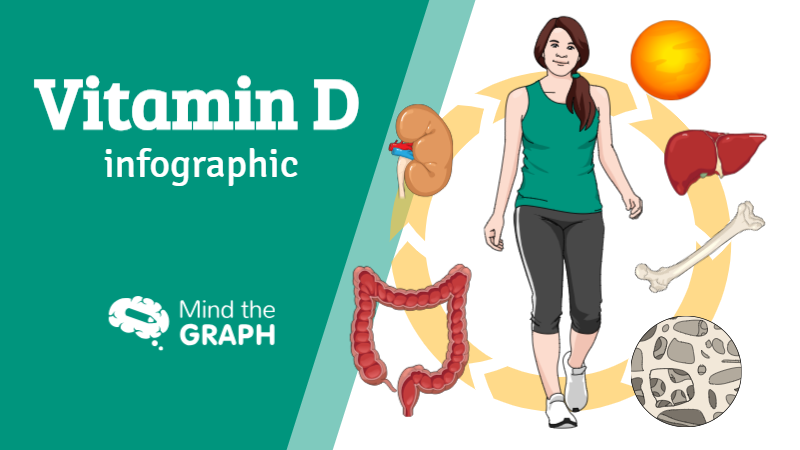
Vitamin D is responsible for increasing intestinal absorption of calcium, magnesium, and phosphate. Unlike other vitamins, […]
During the final materials stage of your paper, most Cell Press journals will ask for […]
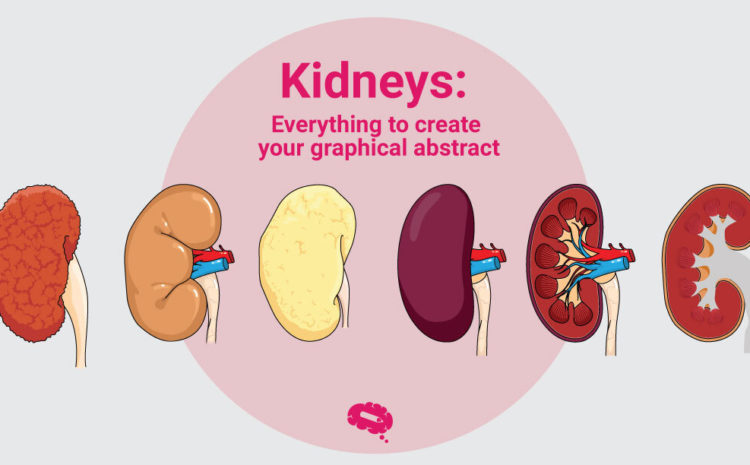
Creating a graphical abstract, infographic or presentation that is visually attractive and scientifically accurate isn’t […]