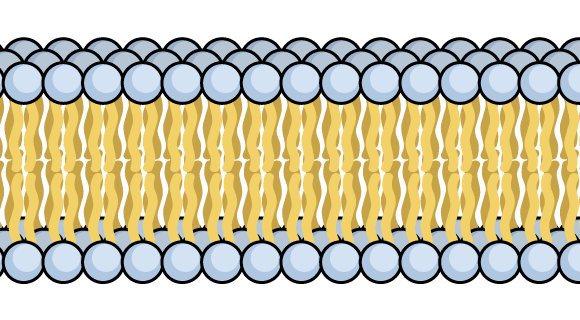
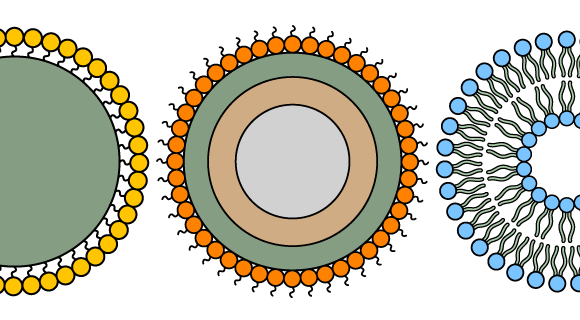
Hi there! As you may know, friday is the day to share the new scientific illustrations. This week we added several exclusive illustrations available to all mind the graph users (free users included). These figures below are a small sample of our complete library. We created the larger online database on scientific illustrations. So, check out the news and feel free to see all the library and try the platform.
Let’s start with these cute squirrel illustrations
They are the newest addition to our zoology collection.
Two new carbon structures
Available in the nanotechnology section
Lyophilizer
A lyophilizer, also know as freeze dryer is an equipment used to water removal process typically used to preserve perishable materials and now you can find it in the lab equipments section.
Rotary evaporator
This equipment is other addition to the lab equipments category. The device is used in chemical laboratories for the efficient and gentle removal of solvents from samples by evaporation. It is also very cute, right?
Serum and blood bags
To our collections of medical illustrations we added serum and blood bags illustrations. You can combine them with other medical illustrations to create your graphical abstract or presentation.
Cell uptake
If you need to show cell uptake or cell signaling this scientific illustration is a good way to illustrate it.
Olfactory discrimination apparatus
You can fin the illustration of this apparatus in the lab equipments category. Using illustrations of apparatus and equipments is a good way to explain your methodology in a scientific poster or presentation.
Lemon
We have a complete library of nutrition illustrations. You can combine the to create visual resources to your patients, to post on social media or to publish in your paper.
Vegetables
How to use these illustrations in your publication:
Mind the Graph is an online platform that allows scientists and teachers to create their own presentations, papers and graphical abstratcs in an atractive and professional way. So, you can try it for free and check all the illustrations available. Besides that, you can combine the figures with shapes, charts, text and upload your own images to make an entire presentation. You can be a free user as long as you want but you will have limited features.
However, with a few dollars per month you can experience unlimited features. In addition, you will be able to request new illustrations at no extra cost. Actually, most of our illustrations are based on requests from our subscribers. Amazing, right?
We also have a help center with several tutorials and our terms of use. But if you still have any doubts, contact us on contact@mindthegraph.com
Feel ready to start?

Subscribe to our newsletter
Exclusive high quality content about effective visual
communication in science.


