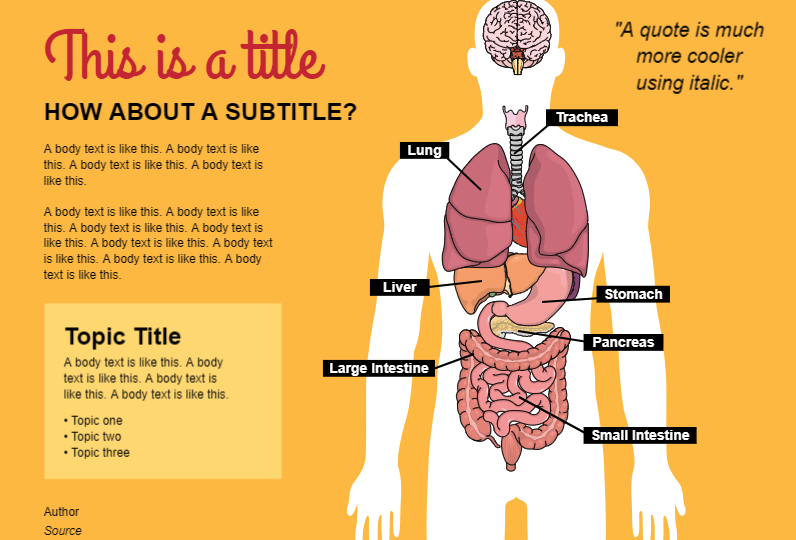
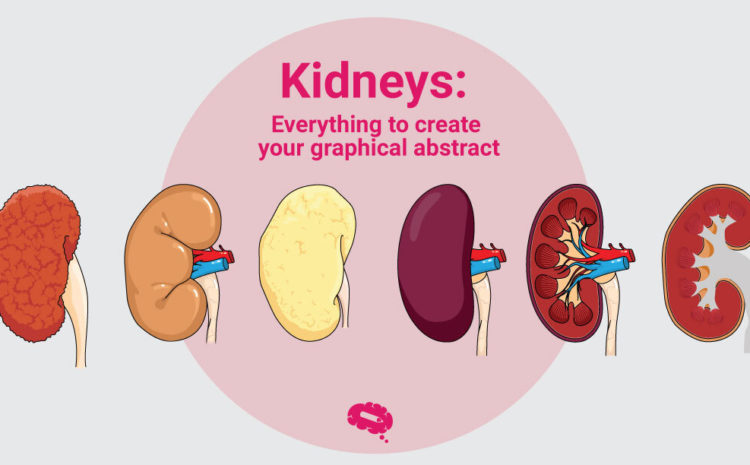
Mind the Graph is an online platform that allows scientists to create graphical abstracts and presentatios that are, at the same, beautiful and scientifically accurate. We are scientists as well, and we know our users aren’t designers. Therefore, we want more than provide scientific illustrations, we want to help our users in the creative process of making graphical abstracts.
Thinking of that, we produce tutorials weekly. You can find our content on the blog, email and, recently, our youtube channel. We added new videos showing how to create visual abstracts, presentations and congress posters. The videos are produced by our designers to show how to choose illutrations, colors, typography and organize all the information in a beautiful way. Also, there are tutorials to teach how to enjoy all the benefits of mind the graph.
Our goal is to empower scientists and improve communication in science. So, we created the video series for you. By watching the videos and using the platform, you should be able to improve your creations for classes, seminars and scientific papers.
See how to create graphical abstracts:

Subscribe to our newsletter
Exclusive high quality content about effective visual
communication in science.


