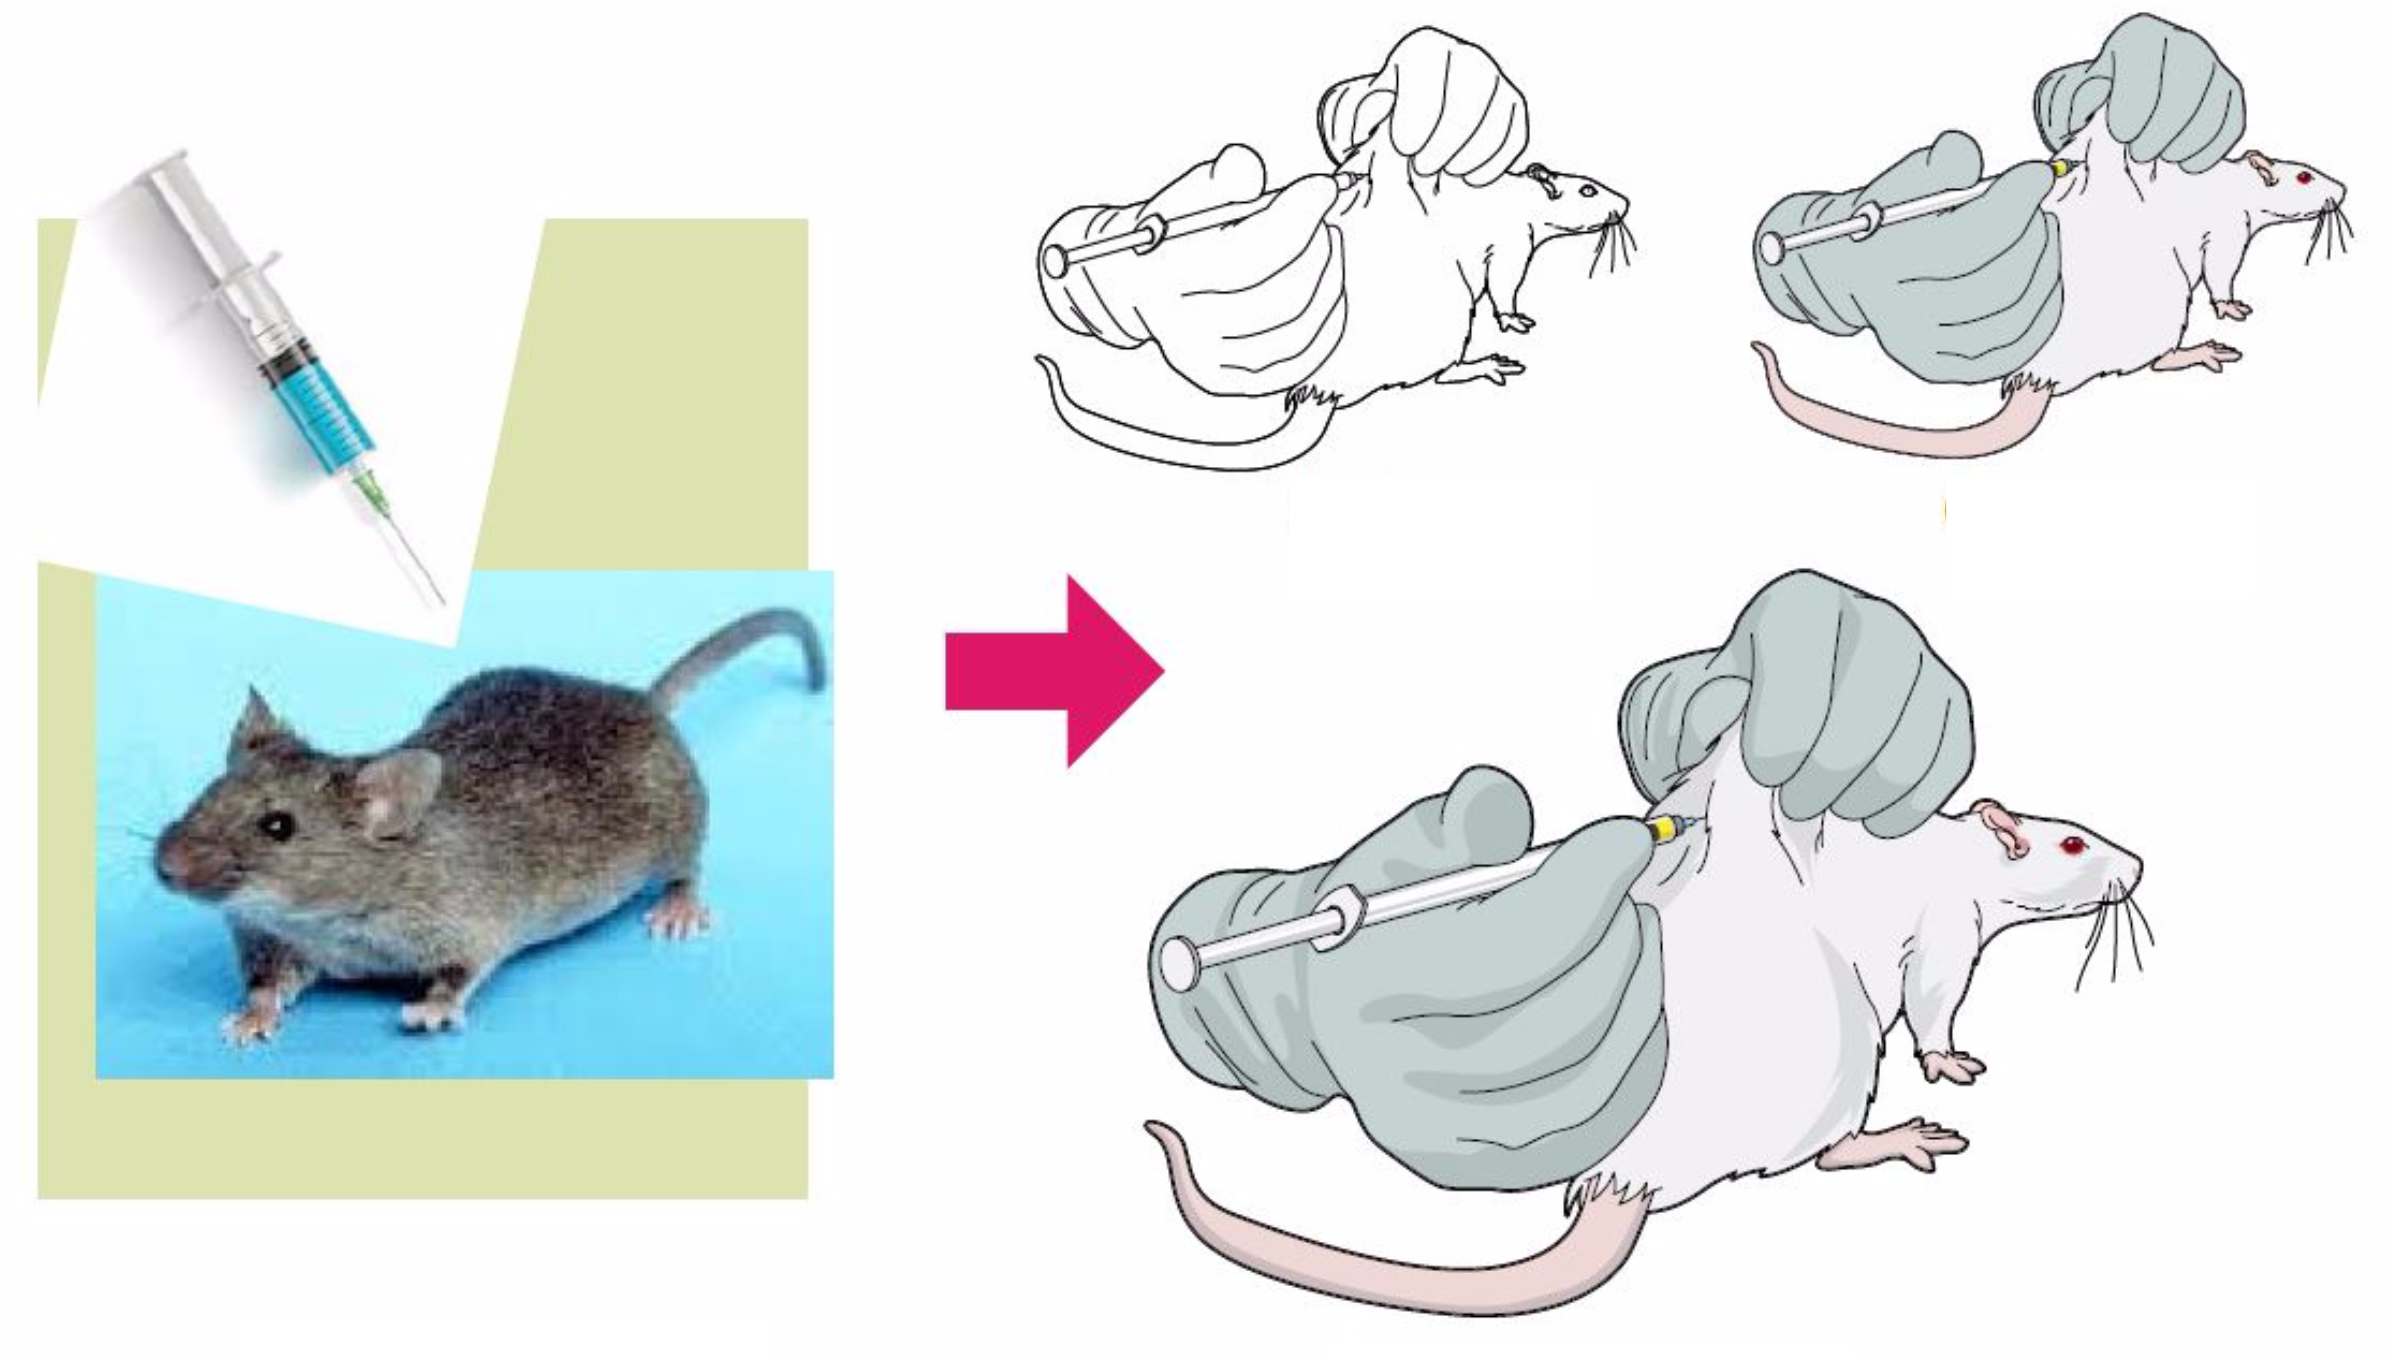
If you are a scientist, you know sometimes it is very difficult to find accurate scientific illustrations to make graphical abstracts. Despite all the efforts scientists spend doing their research, if they show it using illustrations available on google, probably the visual creation willl have a low quality that don’t reflect the data in a professional way.
Many scientists still struggle with absence of scientific illustrations to explain better their work. After all, design softwares are hard to use, google images doesn’t find accurate scientific illustrations and images created using simple editor programs don’t look professional.
For this reason, it is so important that our users understand that Mind the Graph is here to improve science communication. We created Mind the Graph to help scientists that believe in the power of science communication but struggle to make graphical abstracts and presentations in a beautiful and visual way.
We have many students that use mind the graph. However, you know scientific life isn’t easy and sometimes it’s hard to find the money to invest in our work. Because of that, many professors encourage their students, supporting the financial cost to use the platform. Moreover, it’s very easy to get an invoice, so the University itself reimburse the payments.
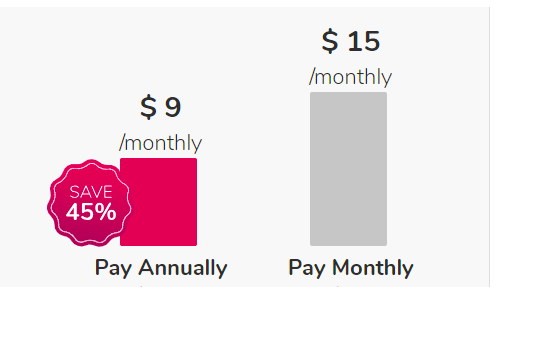
Thinking of that, we give a great discount on the annual plan. It is a opportunity to professors provide tools to their students create a very professional data presentation and save 45%.
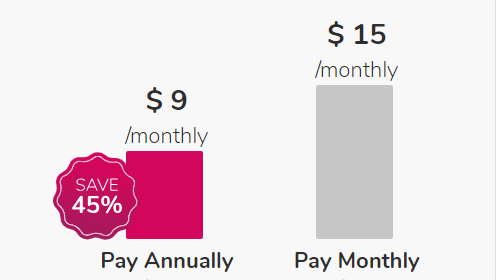
We want you to be proud of your students work!
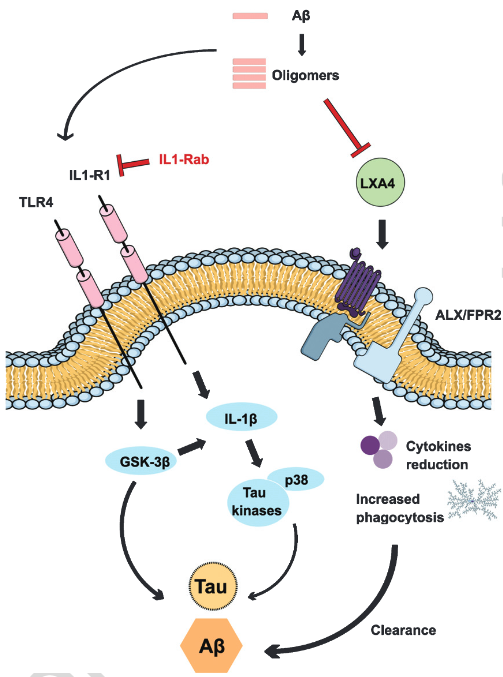
We recently received a good feedback of a PhD student. She created several graphical abstracts of complex metabolic pathways in Mind the Graph. After making the graphical abstracts, she said that her professor was so proud of the result that now he shows her work to everyone.
Only subscribers can make complex figures using as many illustrations as they want. Moreover, subscribers can request new illustrations. So, to make complex graphical abstracts as metabolic pathways, you recommend the researcher plan.
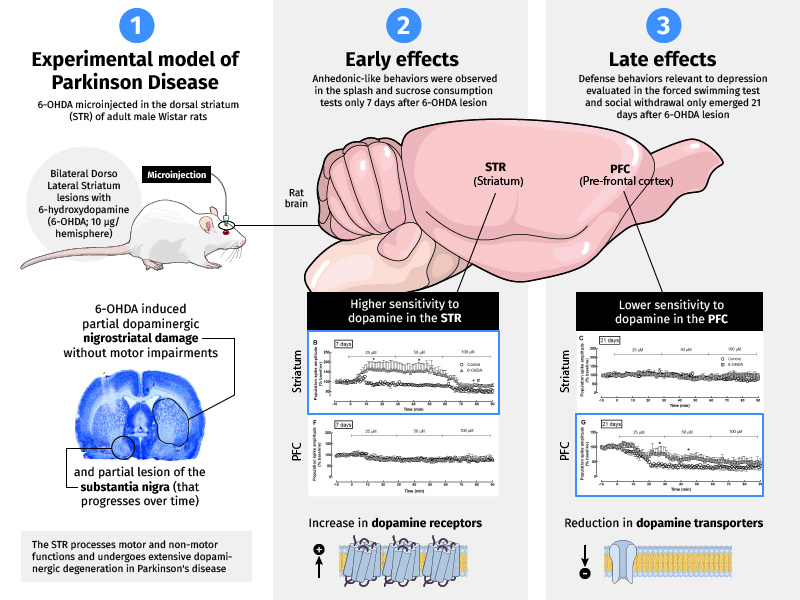
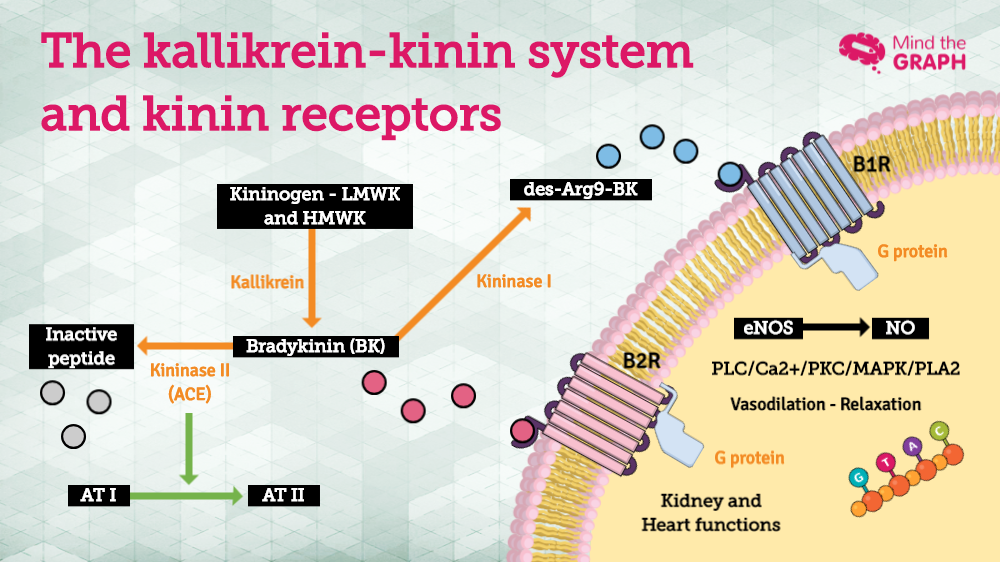
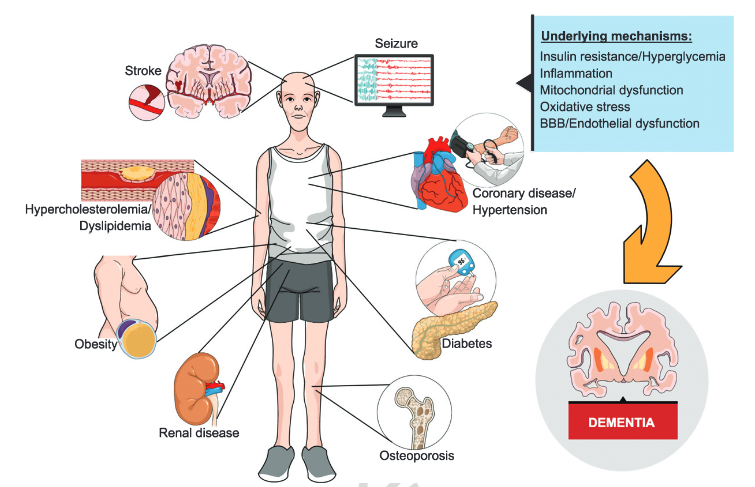
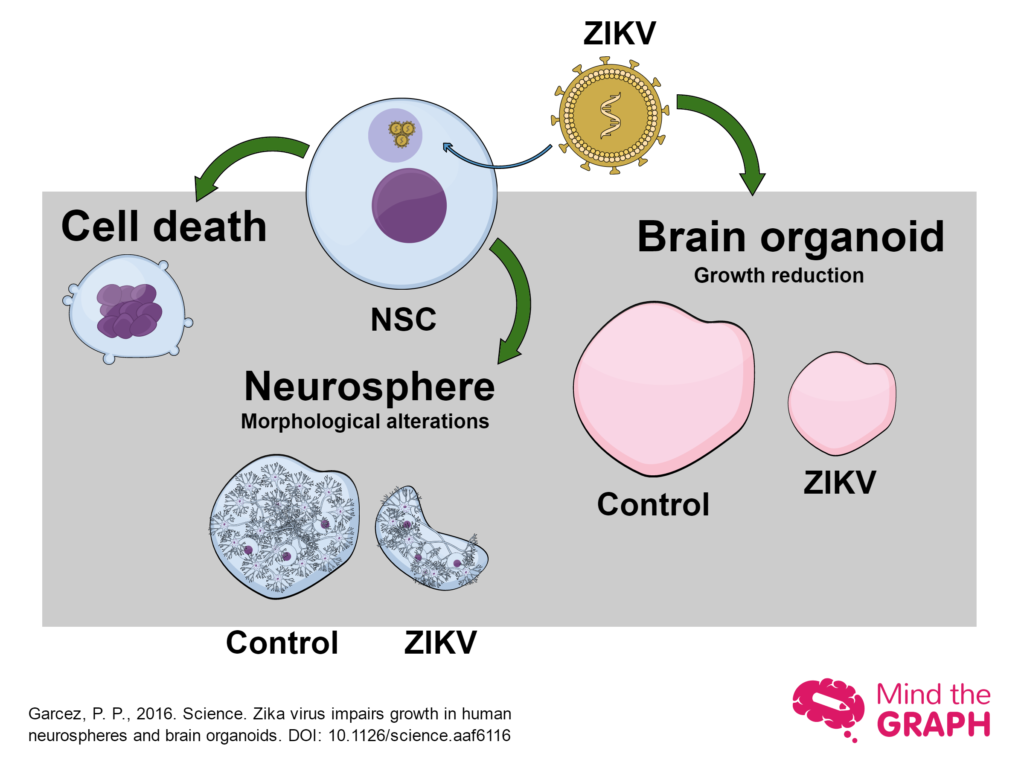
Look some examples of graphical abstracts created using the unlimited resources of the researcher plan:
If you are a professor and want to encourage your students to improve their papers and presentations, look all the benefits of being a subscriber


Subscribe to our newsletter
Exclusive high quality content about effective visual
communication in science.