Si eres un científico, sabes que a veces es muy difícil encontrar ilustraciones científicas precisas para hacer resúmenes gráficos. A pesar de todos los esfuerzos que los científicos dedican a su investigación, si la muestran utilizando ilustraciones disponibles en Google, probablemente la creación visual tendrá una baja calidad que no reflejará los datos de manera profesional.
Muchos científicos siguen luchando con la ausencia de ilustraciones científicas para explicar mejor su trabajo. Al fin y al cabo, los programas de diseño son difíciles de usar, las imágenes de Google no encuentran ilustraciones científicas precisas y las imágenes creadas con simples programas de edición no tienen un aspecto profesional.
Por esta razón, es muy importante que nuestros usuarios entiendan que Mind the Graph está aquí para mejorar la comunicación científica. Hemos creado Mind the Graph para ayudar a los científicos que creen en el poder de la comunicación científica, pero que tienen dificultades para hacer resúmenes y presentaciones gráficas de una manera bonita y visual.
Tenemos muchos estudiantes que utilizan el gráfico de la mente. Sin embargo, saben que la vida científica no es fácil y a veces es difícil encontrar el dinero para invertir en nuestro trabajo. Por eso, muchos profesores animan a sus estudiantes, apoyando el coste financiero para utilizar la plataforma. Además, es muy fácil obtener una factura, por lo que la propia Universidad reembolsa los pagos.
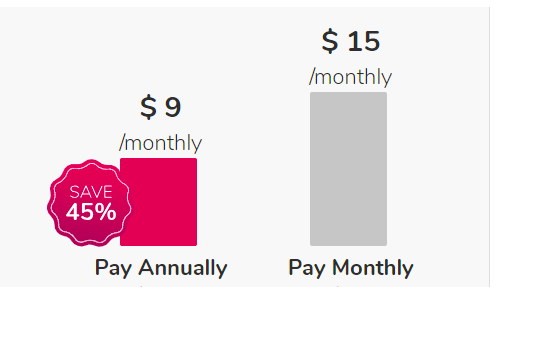
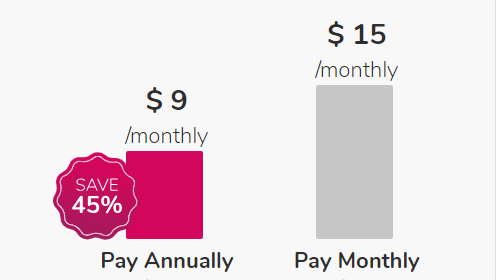
Pensando en eso, damos un gran descuento en el plan anual. Es una oportunidad para que los profesores proporcionen herramientas a sus estudiantes para crear una presentación de datos muy profesional y ahorrar 45%.
Queremos que estés orgulloso del trabajo de tus alumnos.
Recientemente hemos recibido un buen comentario de una estudiante de doctorado. Creó varios resúmenes gráficos de rutas metabólicas complejas en Mind the Graph. Después de hacer los resúmenes gráficos, dijo que su profesor estaba tan orgulloso del resultado que ahora muestra su trabajo a todo el mundo.
Sólo los suscriptores pueden hacer figuras complejas utilizando todas las ilustraciones que quieran. Además, los suscriptores pueden solicitar nuevas ilustraciones. Por lo tanto, para hacer resúmenes gráficos complejos como rutas metabólicas, se recomienda el plan de investigadores.
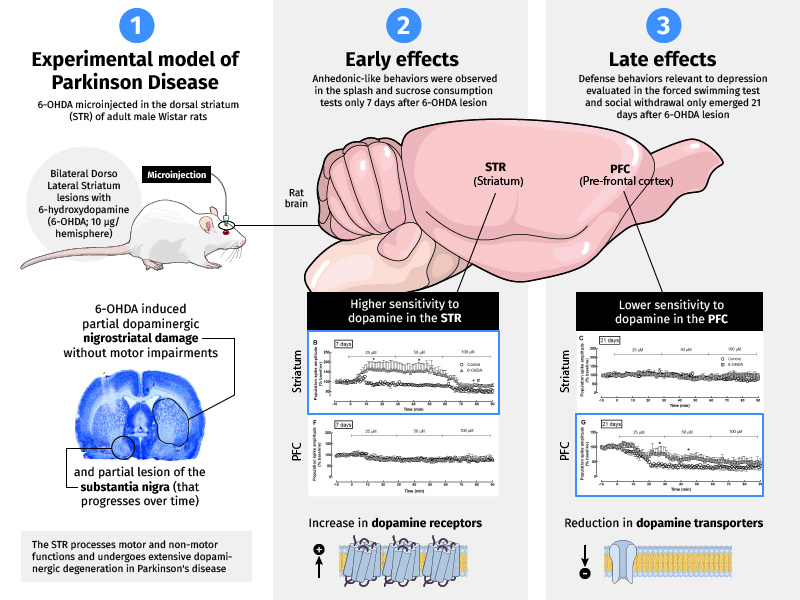
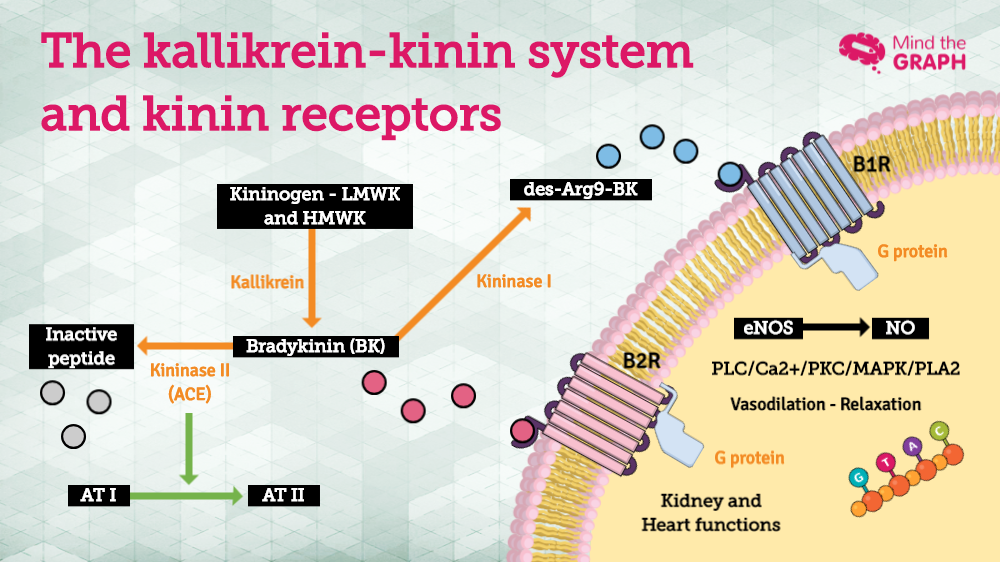
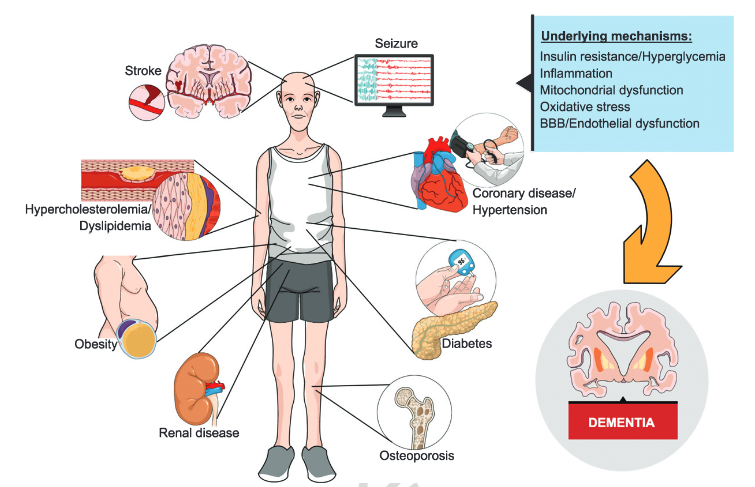
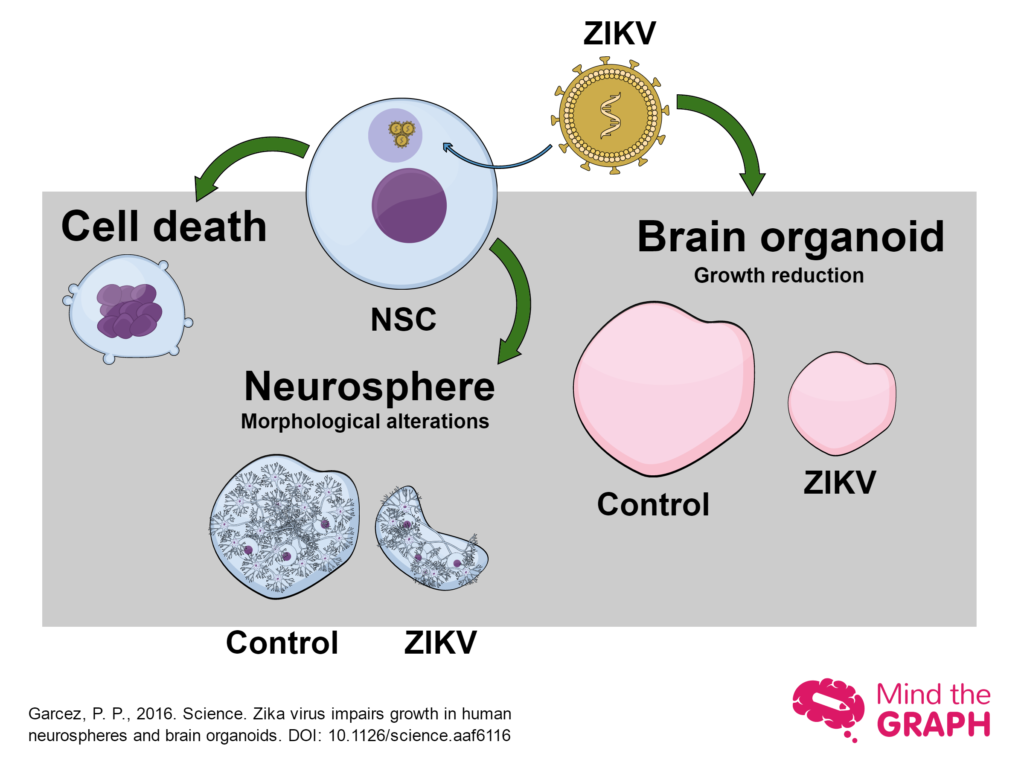
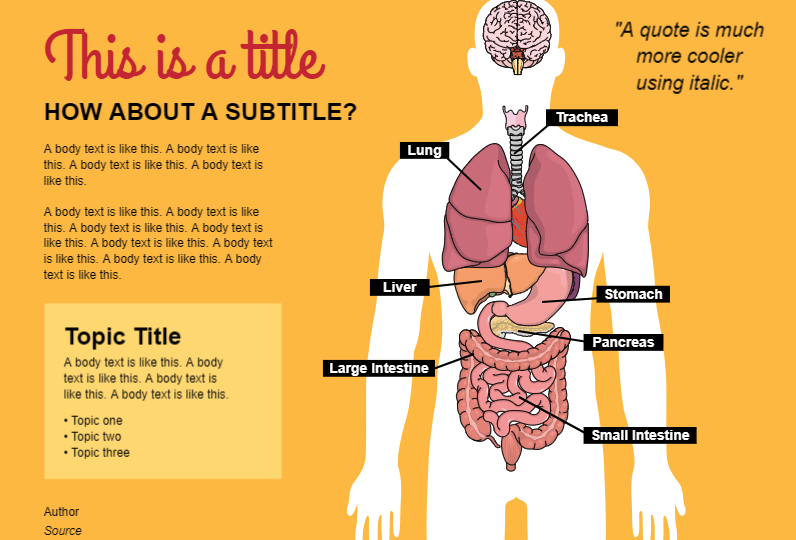
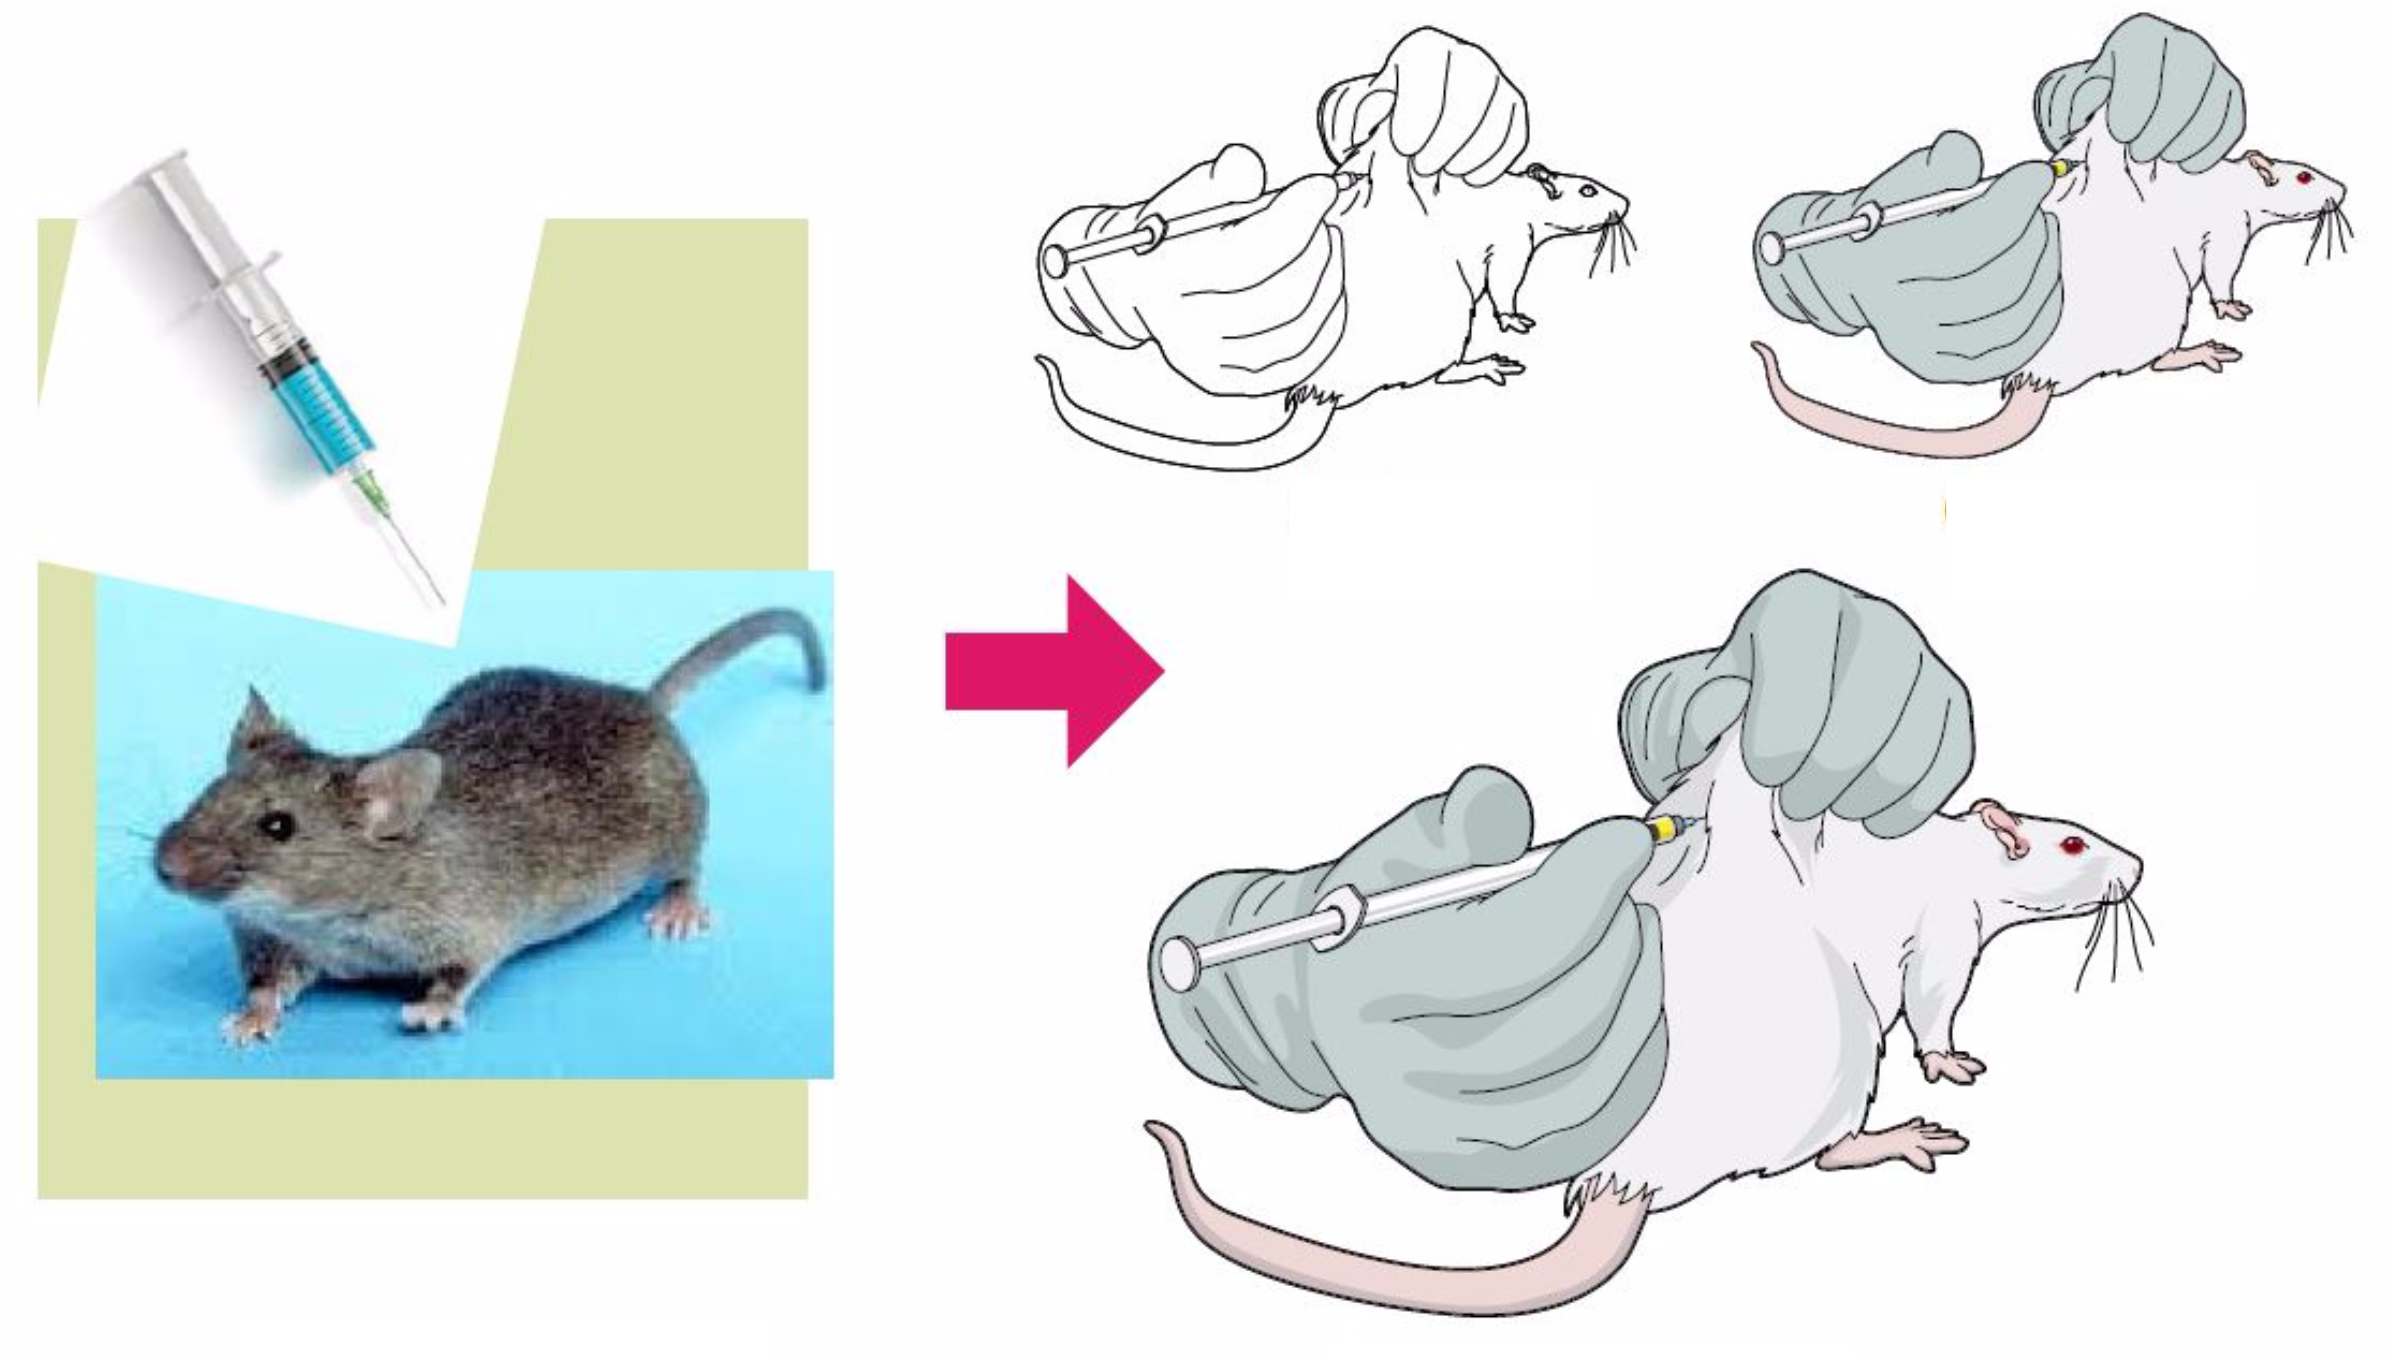
Vea algunos ejemplos de resúmenes gráficos creados utilizando los recursos ilimitados del plan de investigación:

Si eres profesor y quieres animar a tus alumnos a mejorar sus trabajos y presentaciones, mira todas las ventajas de ser abonado


Suscríbase a nuestro boletín de noticias
Contenidos exclusivos de alta calidad sobre la eficacia visual
comunicación en la ciencia.