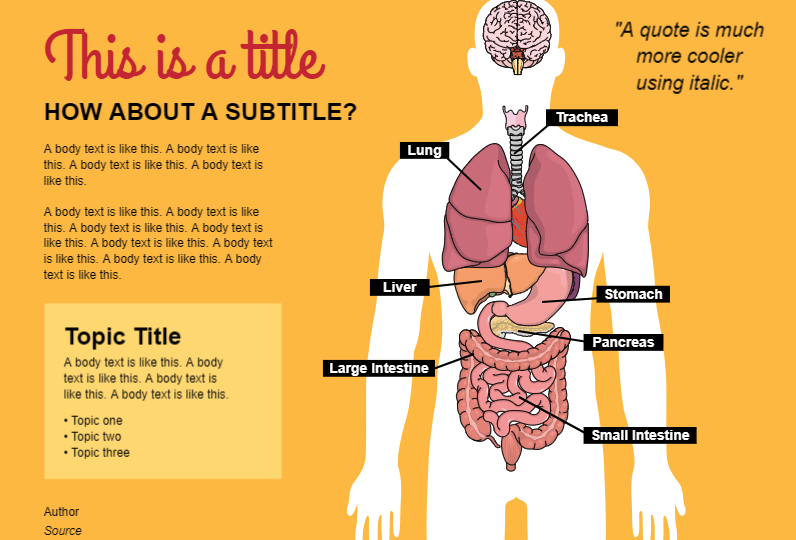
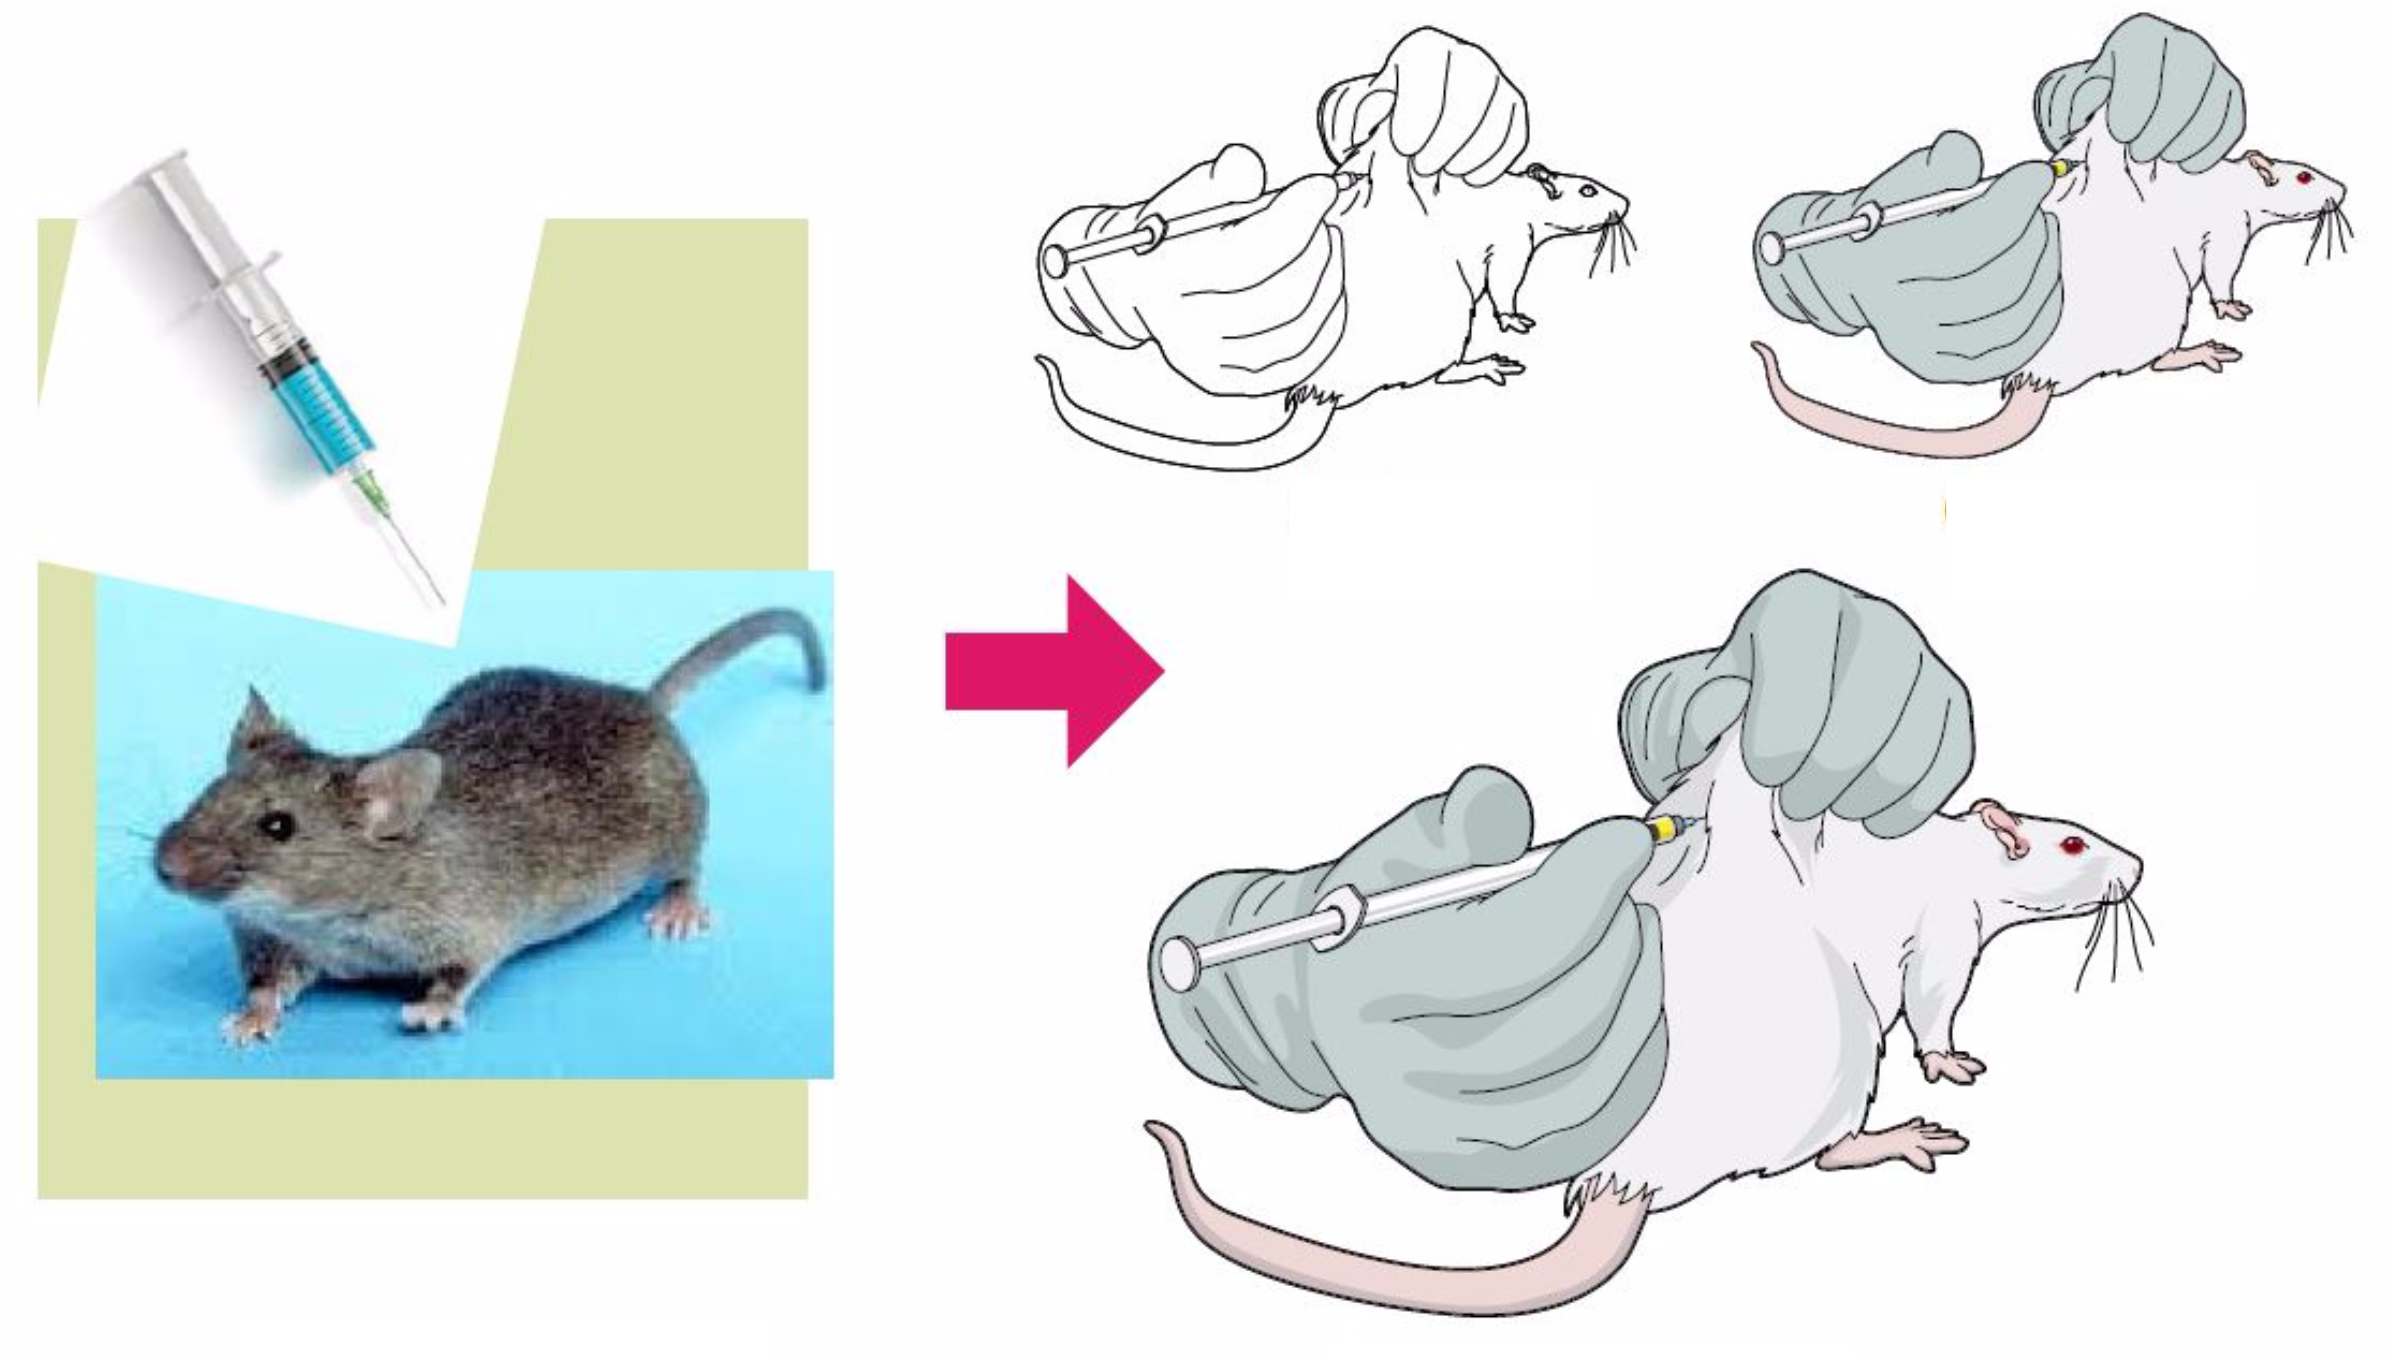
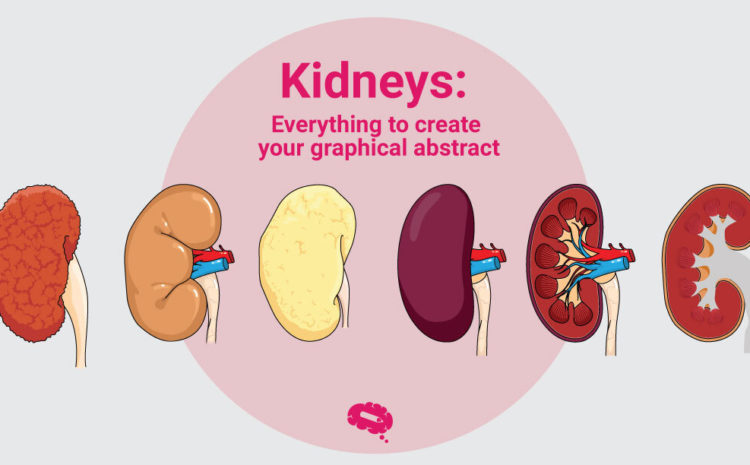
Mind the Graph - это онлайн-платформа, позволяющая ученым создавать графические рефераты и презентации, которые одновременно красивы и научно точны. Мы тоже ученые, и мы знаем, что наши пользователи не являются дизайнерами. Поэтому мы хотим не просто предоставить научные иллюстрации, мы хотим помочь нашим пользователям в творческом процессе создания графических рефератов.
Подумав об этом, мы еженедельно выпускаем обучающие материалы. Вы можете найти наши материалы в блоге, по электронной почте и, с недавнего времени, на нашем канале youtube. Мы добавили новые видео, показывающие, как создавать визуальные тезисы, презентации и постеры для конгрессов. В видеороликах наши дизайнеры показывают, как выбрать иллюстрации, цвета, типографику и красиво организовать всю информацию. Кроме того, есть учебники, обучающие, как пользоваться всеми преимуществами mind the graph.
Наша цель - расширить возможности ученых и улучшить коммуникацию в науке. Поэтому мы создали серию видеороликов для вас. Просматривая видеоролики и используя платформу, вы сможете улучшить свои творения для занятий, семинаров и научных работ.
Посмотрите, как создавать графические абстракции:

Подпишитесь на нашу рассылку
Эксклюзивный высококачественный контент об эффективных визуальных
коммуникация в науке.


