
This post is about a very serious and important topic. Each year nearly 800,000 people experience a new or recurrent stroke. Also, up to 80 percent of strokes can be prevented. So, it is very important to know how to prevent and what are the main stroke symptoms. Thinking about that, I created a few infographics using scientific illustrations to show important medical information.
But, what is a stroke?
According to US National Stroke Association1, a stroke is a “brain attack”. It can happen to anyone at any time. It occurs when blood flow to an area of brain is cut off. When this happens, brain cells are deprived of oxygen and begin to die. When brain cells die during a stroke, abilities controlled by that area of the brain such as memory and muscle control are lost.

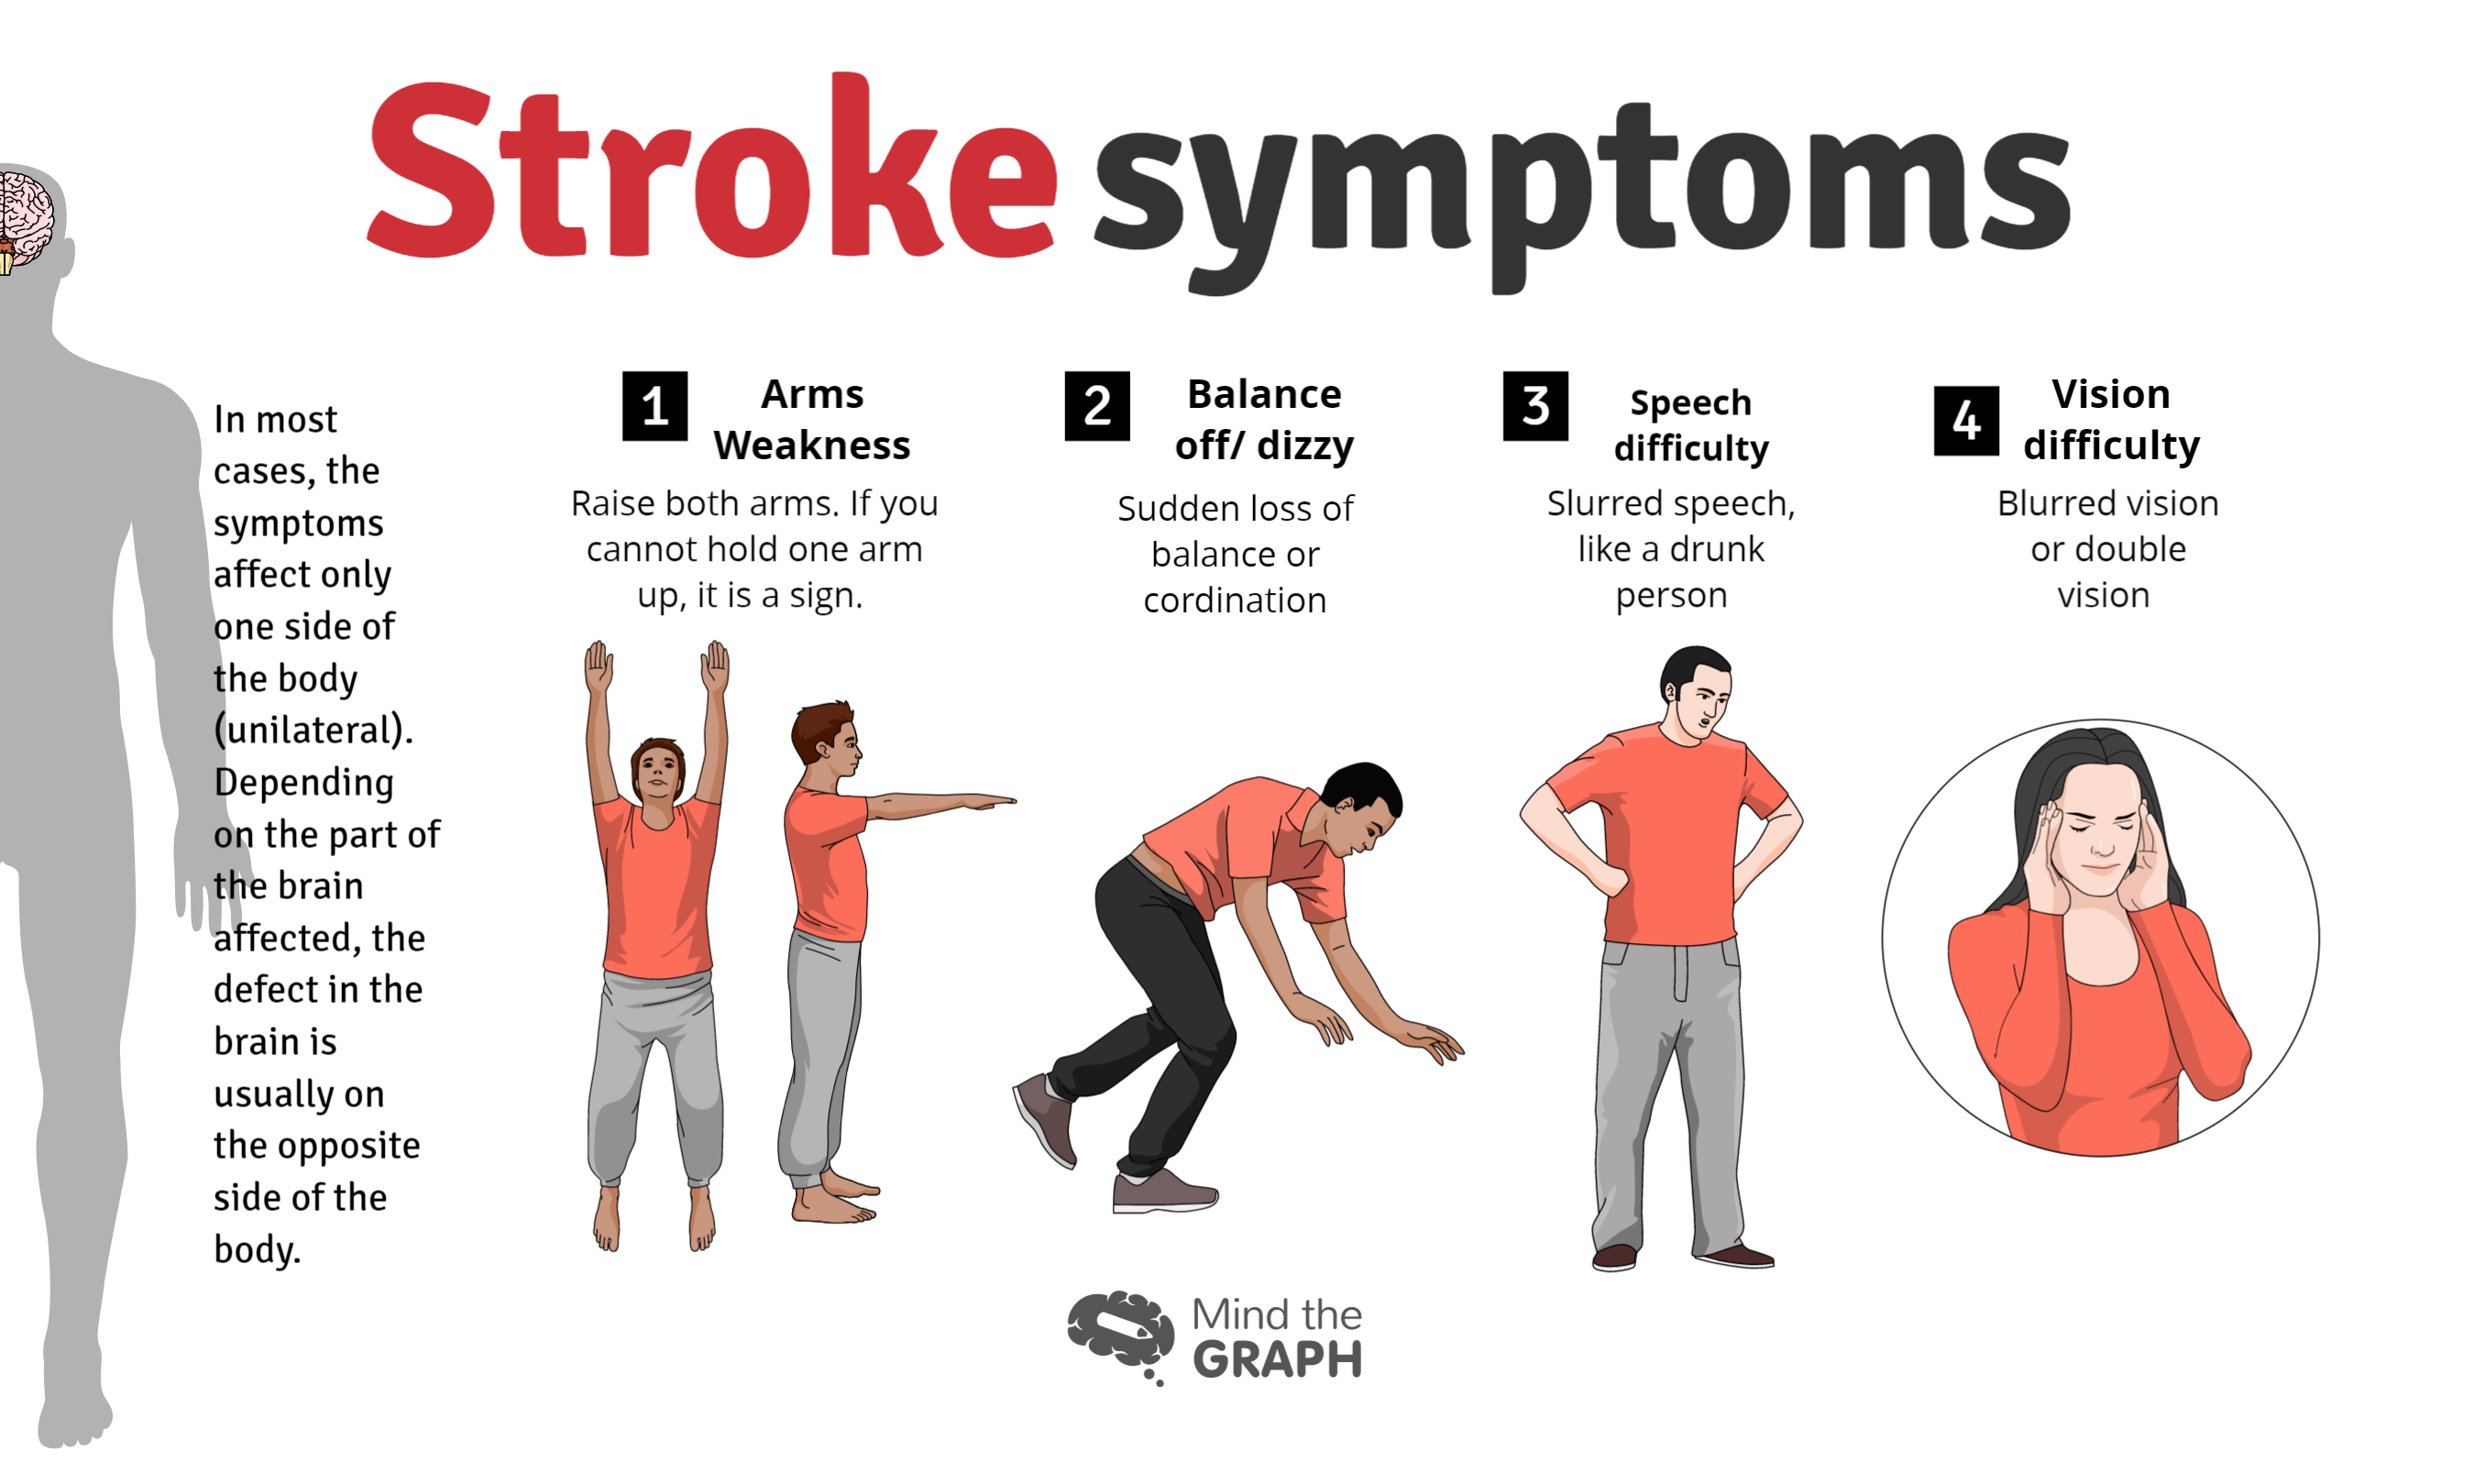
Stroke symptoms
If you start presenting any of these symptoms, you need to talk to your doctor and go to the hospital. It is important to pay attention to people around you and help if necessary. During a stroke, time is crucial and it is very important to receive a medical diagnostic as soon as possible.
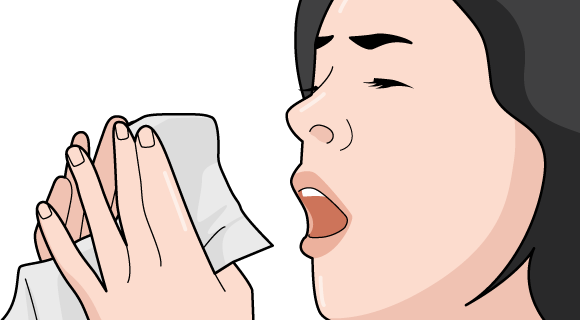
Besides these symptoms, if you suspect that someone is having a stroke, ask the person to smile. If one side of the face appears to be dropping, call a doctor.
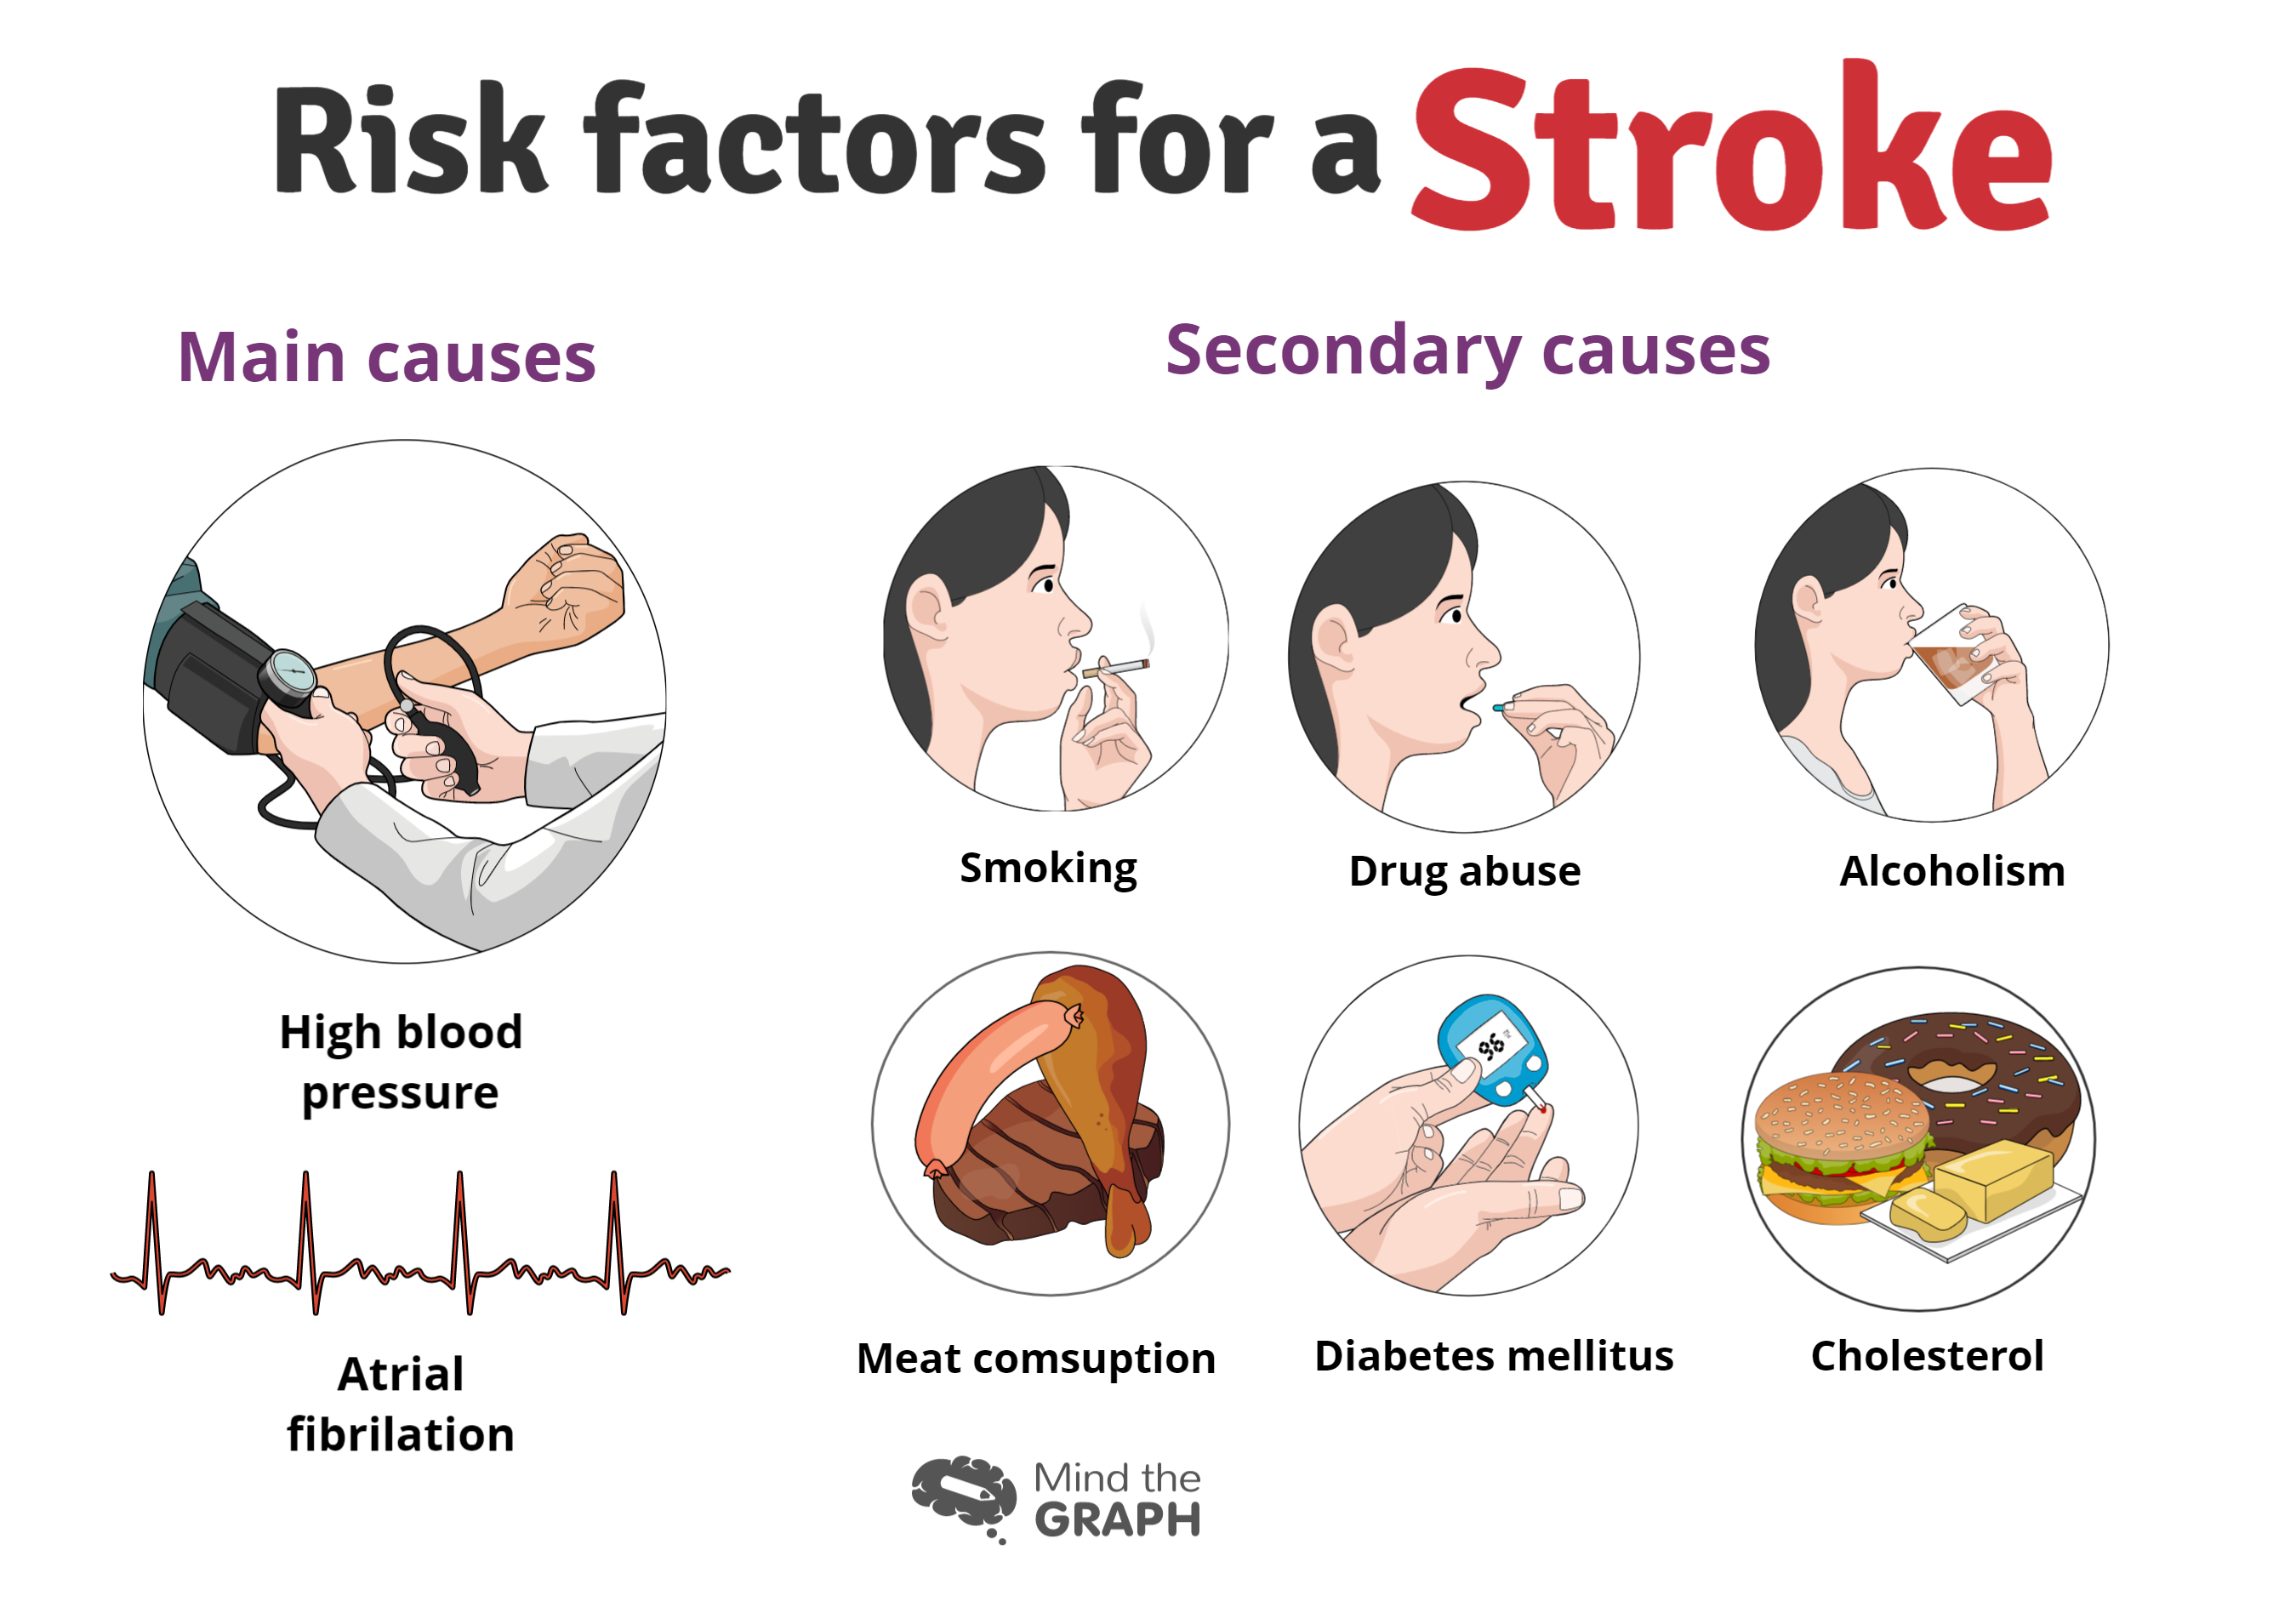
How to prevent?
Create healthy habits is the best way to prevent a stroke. So, make physical exercises, eat well, decrease the stress level, and don’t forget the routine physical examination.
I created these infographics using Mind the Graph. If you want to illustrate your research, you can use Mind the Graph as well.


Subscribe to our newsletter
Exclusive high quality content about effective visual
communication in science.