As ilustrações científicas são uma ferramenta poderosa para comunicar em ciência. Como espécie visual, aprendemos muito melhor quando a informação visual é atrativa e didática. Pensando nisso, estamos aprimorando nossa biblioteca de ilustrações científicas. Temos milhares deles e contando. E, se você é um usuário de gráficos, pode solicitar novas ilustrações e nós faremos isso.
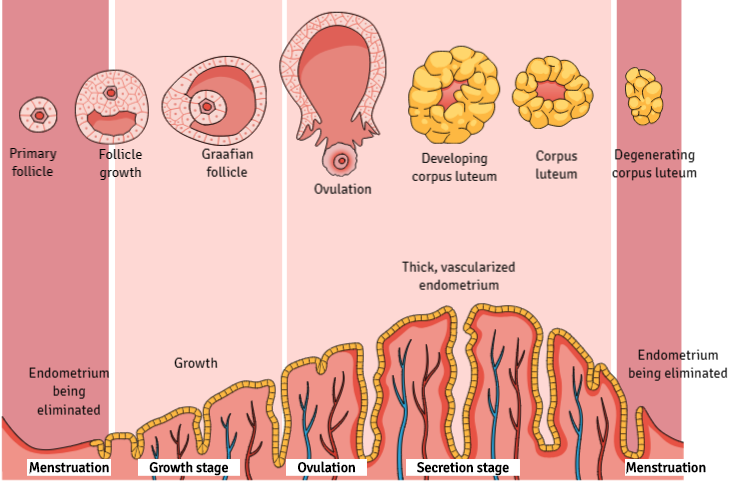
Esta semana criamos um novo infográfico do ciclo menstrual com ilustrações dos folículos ovarianos e do endométrio:

Também criamos um infográfico das fases da gravidez:

Você pode encontrar todas essas ilustrações em Mind the Graph. E se precisar de uma ilustração diferente, pode solicitá-la. Incrível, certo? Se você é médico, pode usar nossas ilustrações para ajudar seus pacientes, mas também pode usar em seus trabalhos ou apresentações em congressos. Se você ainda não é um usuário de gráficos, pode começar agora gratuitamente:


Subscribe to our newsletter
Exclusive high quality content about effective visual
communication in science.