
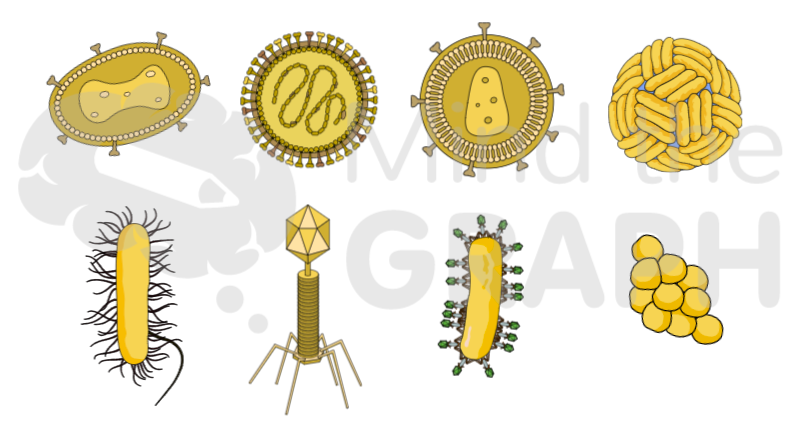
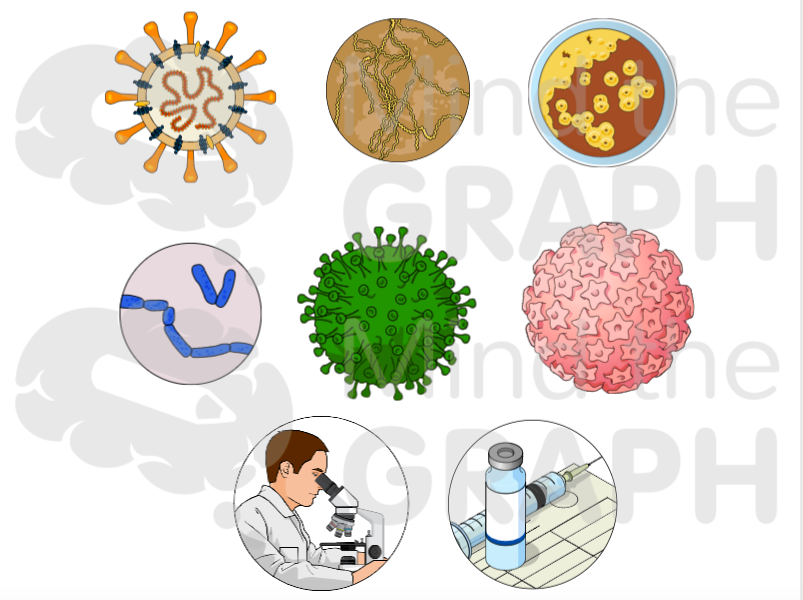
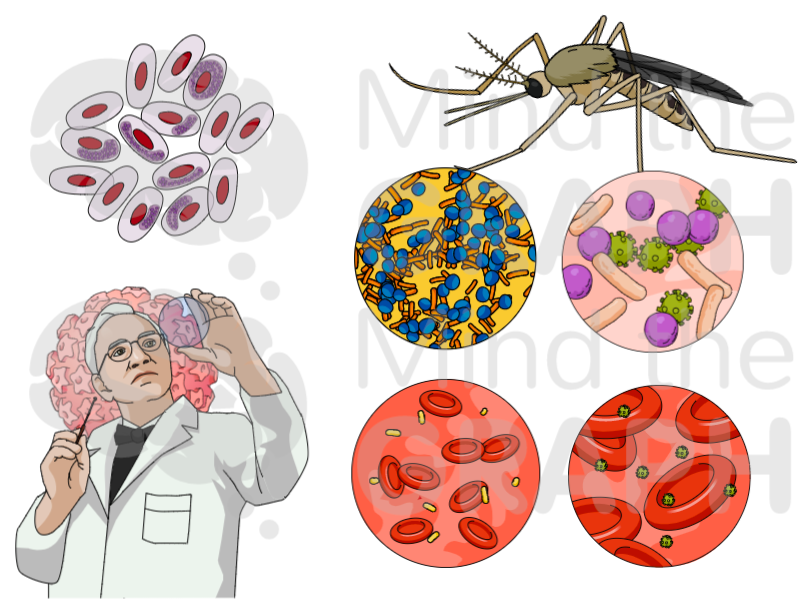
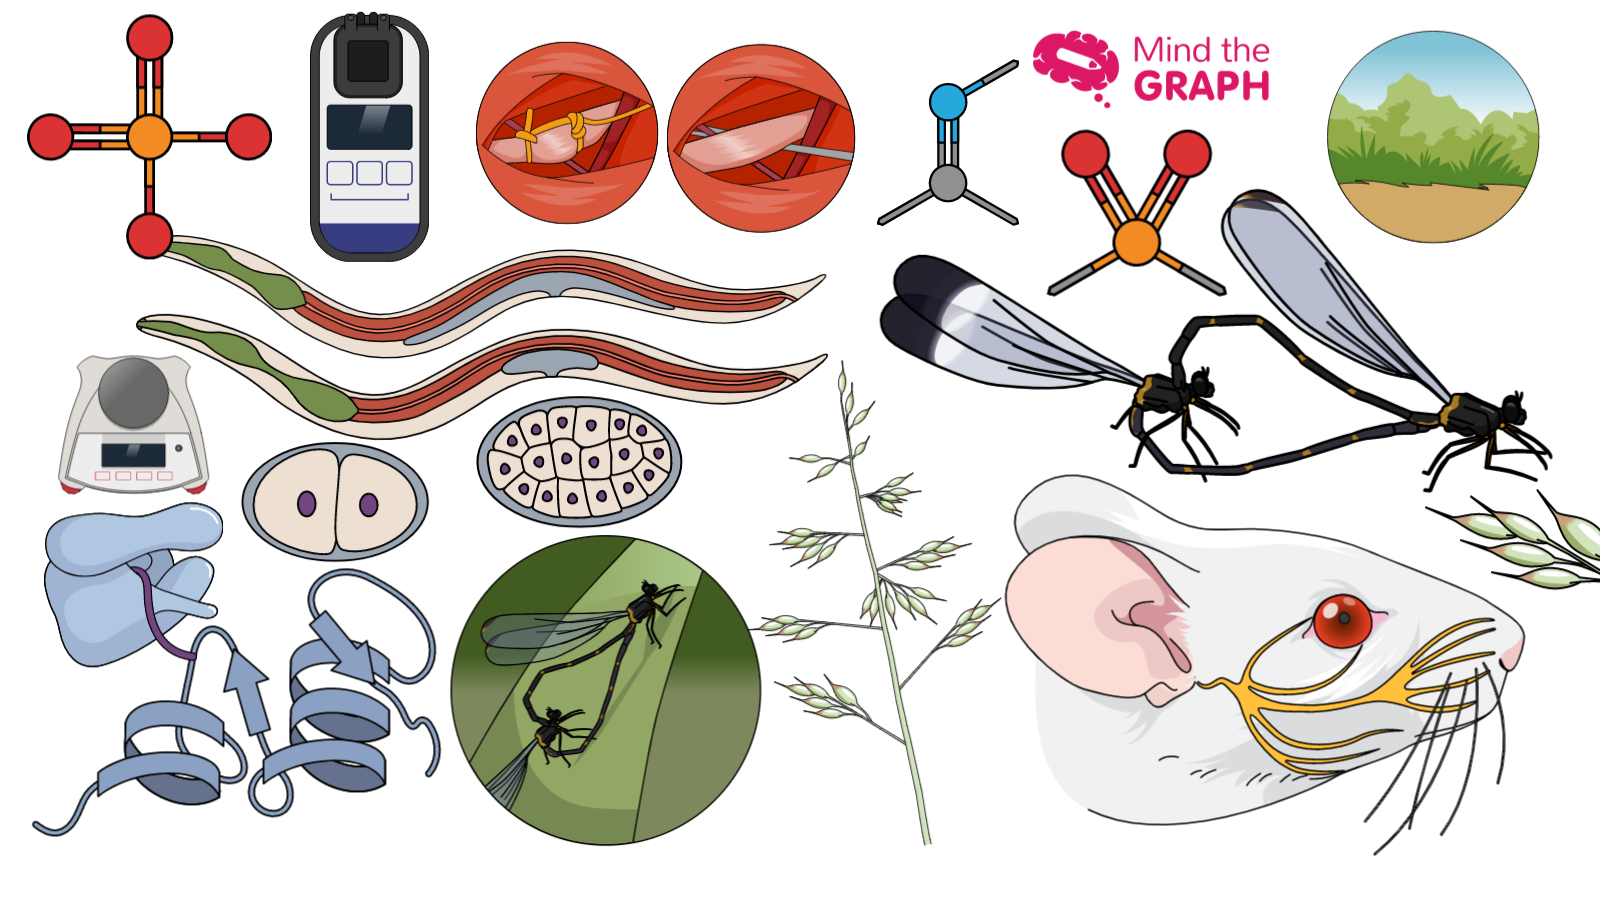
If you need scientific figures, here is the place, we have literally thousands of scientific illustrations for you. This week, we’ll focus on scientific illustrations for medicine, particulatly infectology, microbiology and virology.
Check a few examples of scientific illustrations already available on Mind the Graph. If you are from other scientific area or medicine, we can also serve you, of course. And even if you don’t find exactly what you need in the platform, try to subscribe to use the on demand scientific illustration service.
I wanna use medical scientific illustrations from mind the graph. How can I do that?
Mind the Graph is an online platform that allows scientists and teachers to create their own presentations, papers and graphical abstratcs in an atractive and professional way. So, you can try it for free and check all the scientific illustrations available.
Besides that, you can combine the figures with shapes, charts, text and upload your own images to make an entire presentation. You can be a free user as long as you want but you will have limited features.
However, with a few dollars per month you can experience unlimited features. In addition, you will be able to request new illustrations at no extra cost. Actually, most of our illustrations are based on requests from our subscribers.


Subscribe to our newsletter
Exclusive high quality content about effective visual
communication in science.