
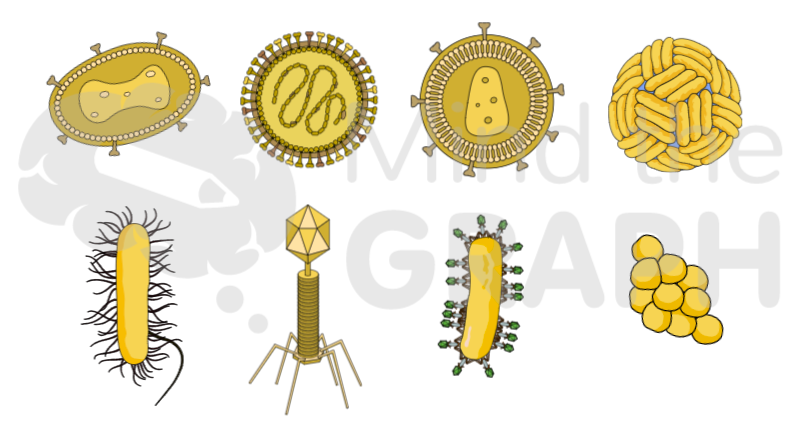
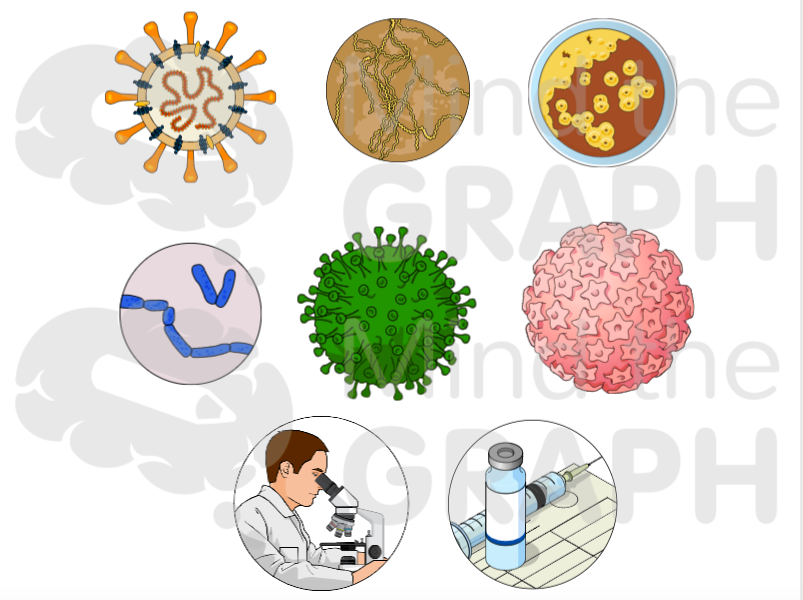
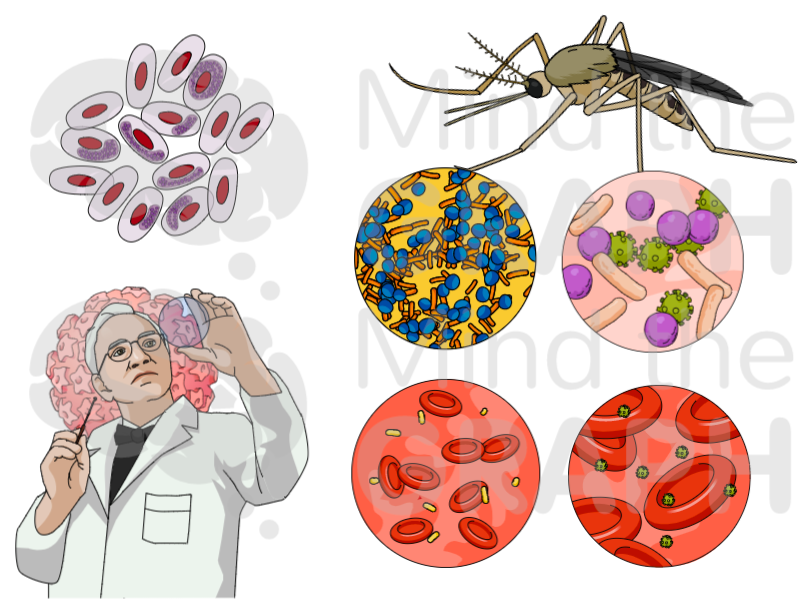
Hvis du trenger vitenskapelige tall, here is the place, we have literally thousands of scientific illustrations for you. This week, we’ll focus on scientific illustrations for medicine, particulatly infectology, microbiology and virology.
Se noen eksempler på vitenskapelige illustrasjoner som allerede er tilgjengelige på Mind the Graph. Hvis du er fra et annet vitenskapelig område eller medisin, kan vi selvfølgelig også hjelpe deg. Og selv om du ikke finner akkurat det du trenger i plattformen, prøve å abonnere på tjenesten for vitenskapelig illustrasjon på forespørsel.
Jeg vil bruke medisinsk-vitenskapelige illustrasjoner fra mind the graph. Hvordan kan jeg gjøre det?
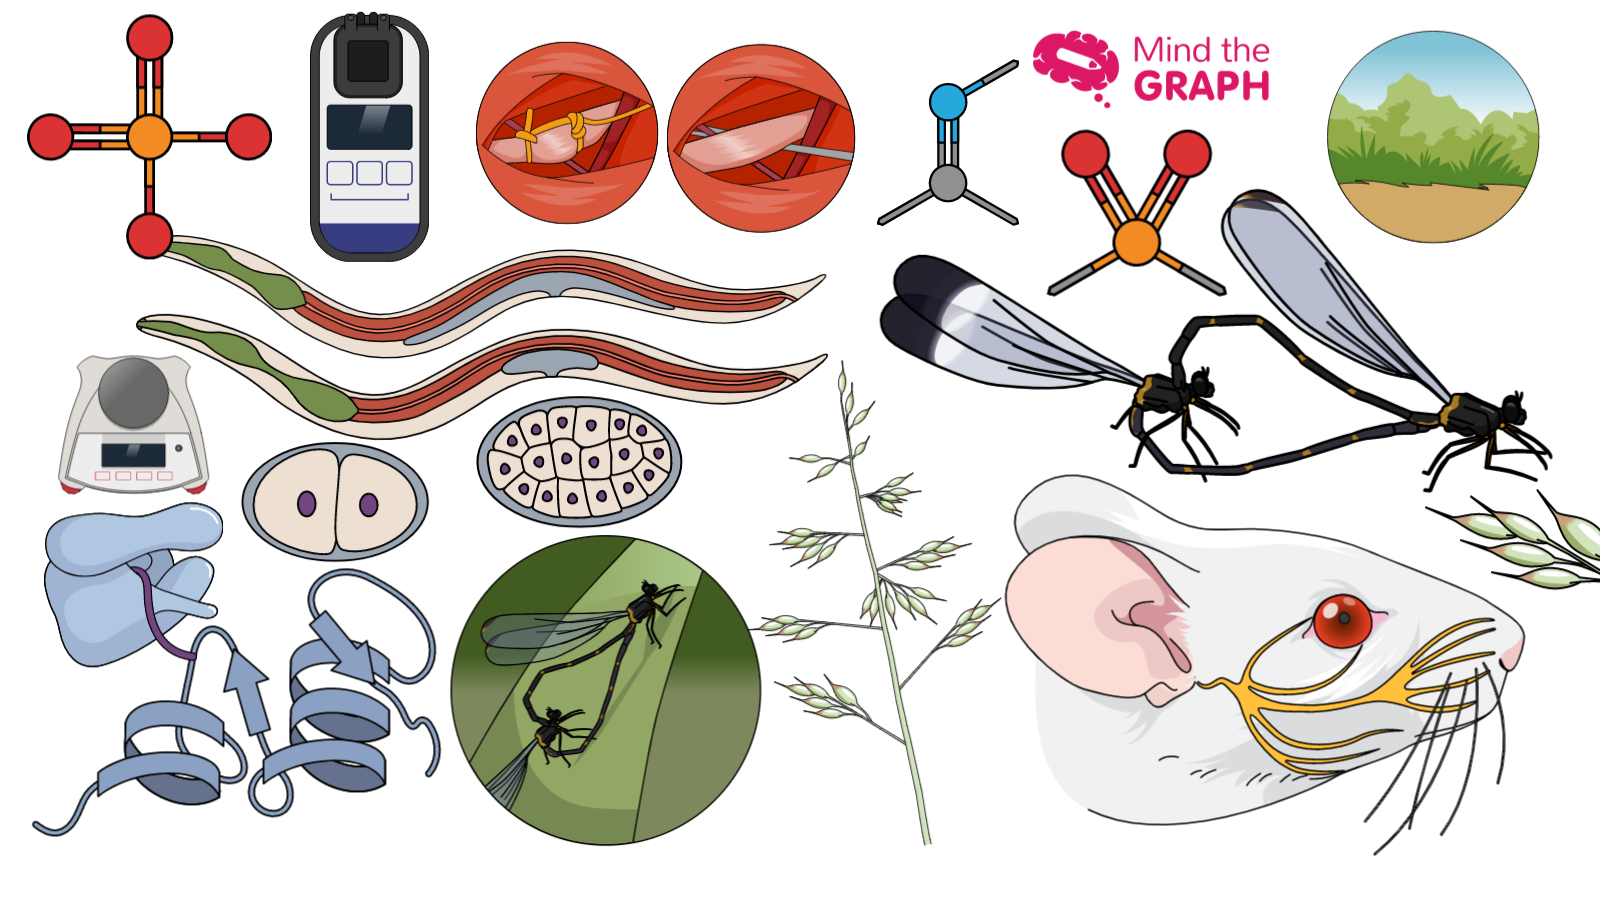
Mind the Graph er en nettbasert plattform that allows scientists and teachers to create their own presentations, papers and graphical abstratcs in an atractive and professional way. So, you can try it for free and check all the scientific illustrations available.
Besides that, you can combine the figures with shapes, charts, text and upload your own images to make an entire presentation. You can be a free user as long as you want but you will have limited features.
Med noen få dollar i måneden kan du imidlertid gjøre følgende oppleve ubegrensede funksjoner. I tillegg vil du kunne be om nye illustrasjoner uten ekstra kostnad. Faktisk er de fleste av illustrasjonene våre basert på forespørsler fra abonnentene våre.


Abonner på nyhetsbrevet vårt
Eksklusivt innhold av høy kvalitet om effektiv visuell
kommunikasjon innen vitenskap.