CACTUS acquires Mind the Graph, a SaaS platform for infographic creation
CACTUS plans to scale up its technology offerings by providing an automated DIY solution for their customers in academia and the life science industry.
Read helpful content about Mind the Graph tool, such as: tips, solutions, benefits, partnerships, and more.
CACTUS plans to scale up its technology offerings by providing an automated DIY solution for their customers in academia and the life science industry.
Ever tried to create a molecular illustration with classic molecular viewers? If the answer is […]
Nature Special Edition Welcome, everyone! Welcome to this very special edition of Mind the Graph […]
Welcome to the Mind the Graph Experience! This is the first article of a series […]
Whether you are a professor responsible for a research laboratory or a scientist part of […]
Visuals such as Infographics and presentations are a great content marketing tool. However, they might […]
Working on your next big microbiology poster? Wondering how not to make it look like […]
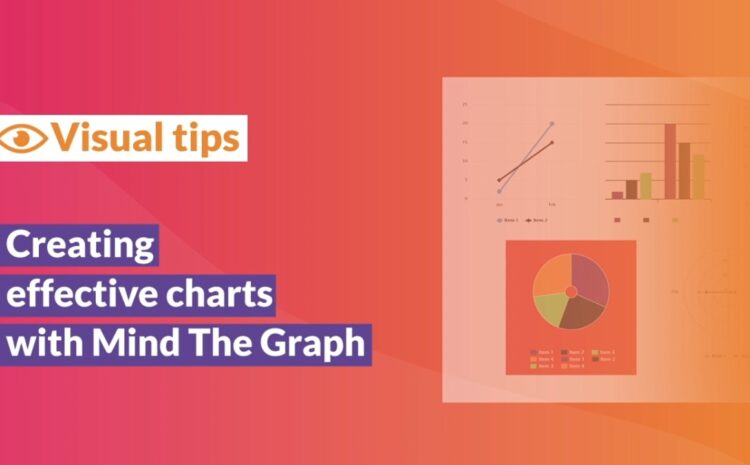
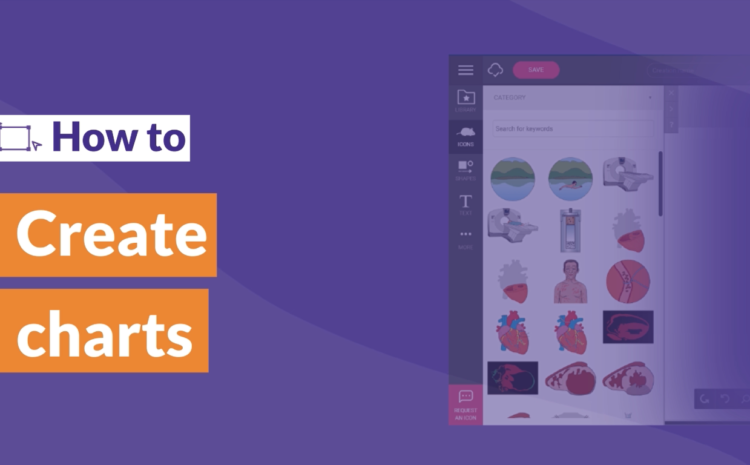
This tutorial video shows how you can create a effective charts in Mind the Graph. […]
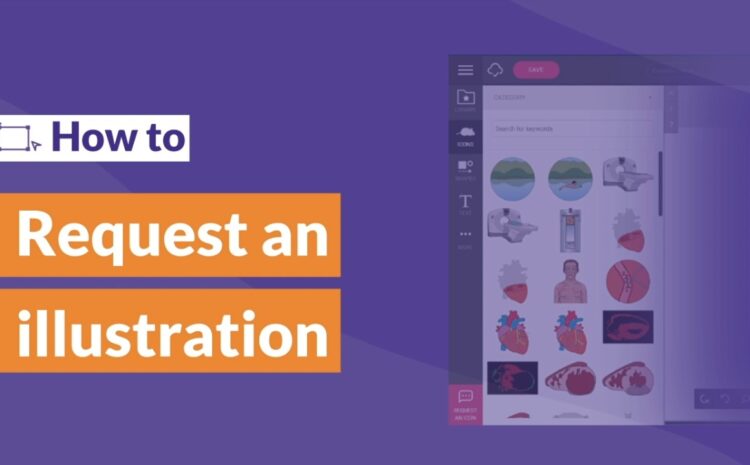
This tutorial video shows how you can request a illustration in Mind the Graph. You […]
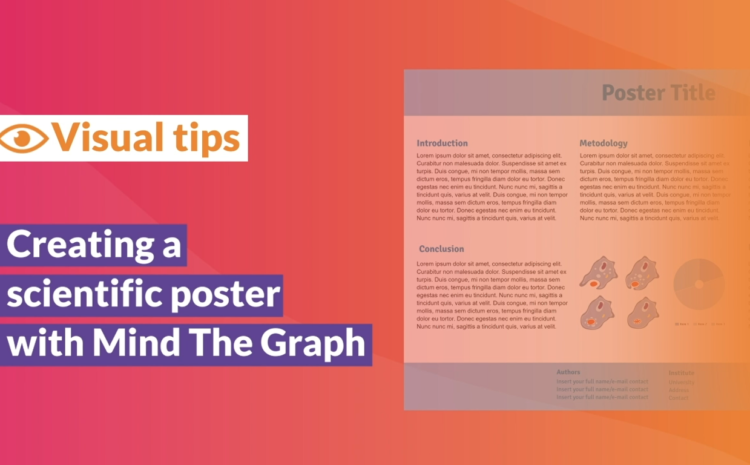
This tutorial video shows how you can create a scientific poster in Mind the Graph, […]
This tutorial video shows how you can create scientific charts in mind the graph. You […]
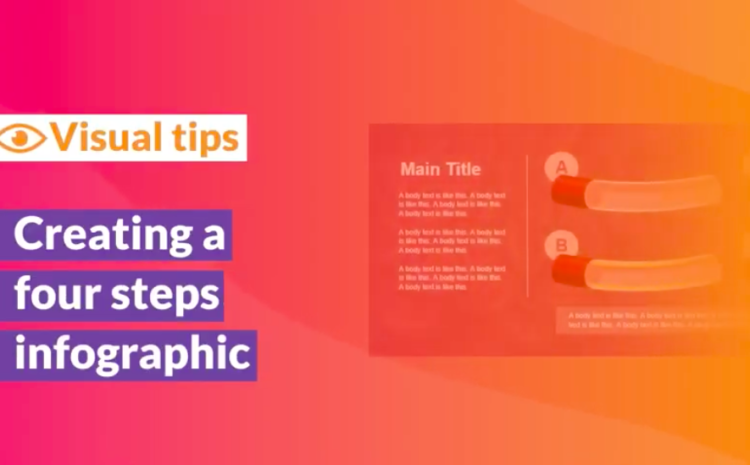
This tutorial video shows you how to create an infographic on Mind the Graph. The […]
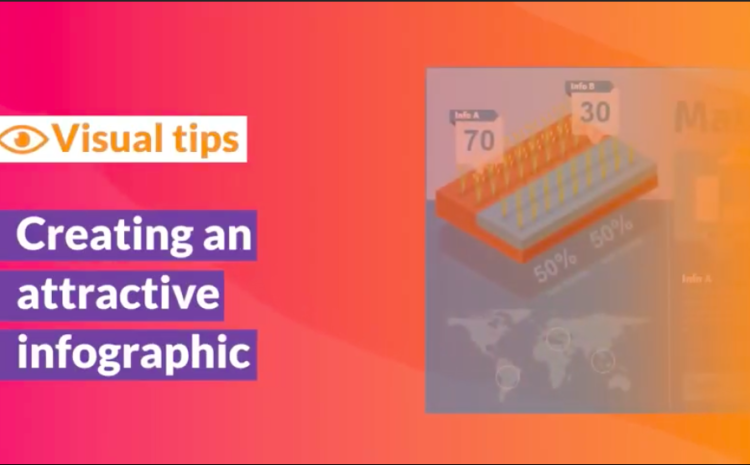
Tutorial video on how to create an attractive infographic with scientific illustrations on Mind the […]