Visuals such as Infographics and presentations are a great content marketing tool. However, they might not be the easiest to design and create unless you have access to the right tools.
There are lots of popular graphic design tools in the market. Hence, it can get overwhelming to pick one and stick to it. You don’t want to be trying out all the tools and wasting your time.
Two of the most prominent graphic design tools that you might be considering are Mind the Graph and Piktochart.
While Piktochart is one of the most popular design tools out there, Mind the Graph is one of the best, more affordable Piktochart alternatives.
Piktochart is great for simple infographics, posters, and presentations. And Mind The Graph, one of the most popular alternatives to Piktochart, helps you create high-quality design infographics, graphical abstracts, scientific posters, and presentations with ease within a few minutes.
An infographic tool must be something that fits your exact needs and requirements. So, if you’ve been confused about the tool that you want to go for, then we’ve got you covered.
In this comprehensive guide, we’ll objectively break down the pros and cons of Piktochart and Mind the Graph, so you can save time, pick the right tool of your choice, and go about with your day.
Usability – Mind the Graph vs. Piktochart
Usability is one of the first factors you must consider when picking a tool, especially for graphic design.
This is because creating designs from scratch may usually be an overwhelming task if you do not have any professional experience in graphic design.
Without the right tool, the learning curve for creating the initial few designs would be too high. This is definitely not something that you’d want for you and your team.
If you’re a designer, getting used to a new tool may be time-consuming. Hence, most marketers and designers look for usability as one of the top features in a graphic design tool, and you should too.
Piktochart
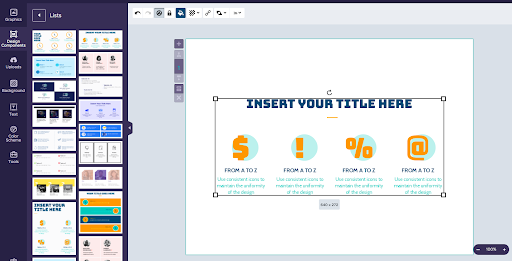
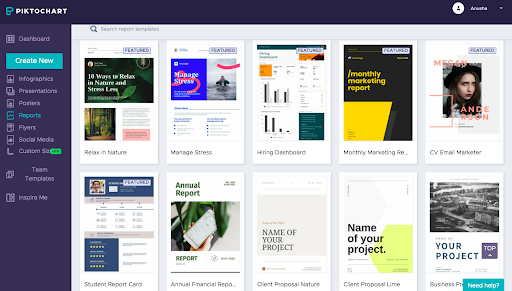
Piktochart scores great on usability. Be it infographics, posters, graphics, reports, or presentations.
You get a wide variety of templates to choose from. This makes it easy for you to pick a template and tweak it based on your designs.
Piktochart gives you a free library full of icons, illustrations, and images. So, you can search for the ones you’d want to add, and your design will be ready.
Things get a little difficult when you’d want to start any design from scratch instead of going with the premade templates.
You might want to go with this option if you have a specific design in mind. Or if you want to go for designs that are ultra-personalized to fit your business requirements.
For example, suppose that you want to create a customized template for all your social media graphics and want it to be unique and customized to your branding. Then going with a premade template might not be the best option.
For such cases, Piktochart might seem overwhelming to start from scratch. You’ll probably find yourself looking for some free alternatives to Piktochart that are easy to understand and use.
Mind the Graph
Talking about the best alternative to Piktochart, which is Mind the Graph, we can easily say that it is less overwhelming and easier to use.
Mind the Graph is a pretty simple and intuitive tool to work with. It has some really simple yet powerful design options which help you get done with your designs in a few minutes.
The learning curve with Mind the Graph is definitely low as the tool makes it a point to help you intuitively move through the complete design process.
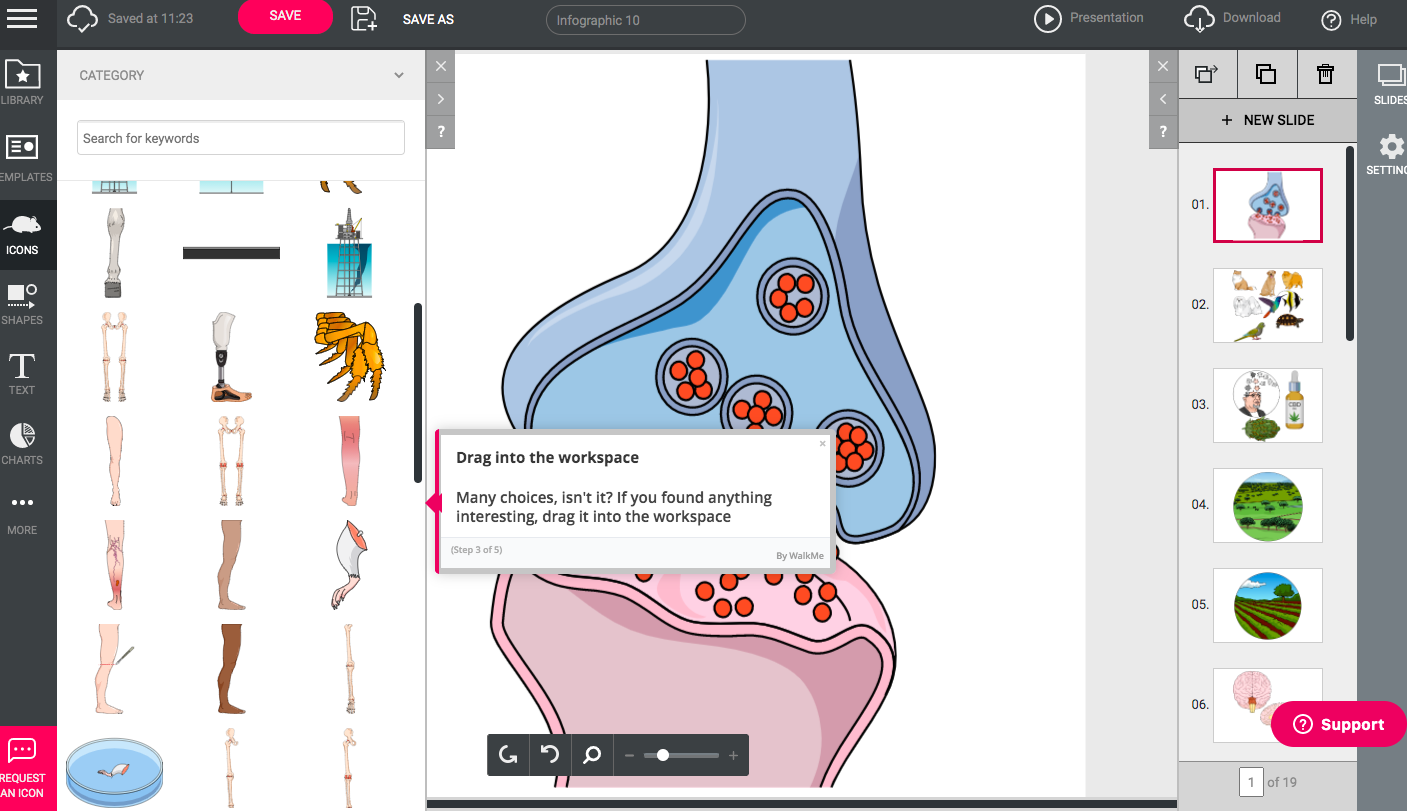
The ease of usability holds true even when you start a design from scratch. The tool guides you through all the steps using tool-tips that exactly let you know the next steps.
Instead of an overwhelming tour of the tool at the start, the tool-tips will pop up whenever you start using a new feature for your design.
The design options are also pretty self-explanatory, and you wouldn’t find yourself searching for answers and wondering what these design features mean.
Customizing your designs based on your requirements and branding is also pretty easy when you opt for a free Piktochart alternative such as Mind the Graph.
Verdict
To sum it up, Mind the Graph definitely scores high when it comes to the usability of the tool. But we must say that Piktochart isn’t far behind as well, and you’ll get the hang of it once you start using it for a while.
Uniqueness – Mind the Graph vs. Piktochart
Now you may be wondering what’s so unique about Piktochart and Mind the Graph. What makes them unique, and in what way can it help you with your goals? Both the design tools are unique in their own way. Let’s discuss each of them in detail.
Both Piktochart and Mind the Graph share some excellent features, such as a huge library of templates to choose from, an easy drag-and-drop visual canvas, great design components, and multiple sizing options.
Piktochart
What makes Piktochart unique is its data visualization feature. The tool allows you to form visual illustrations of your data in the form of charts and graphs. You can link up your data using Excel or Google Sheets, and the tool will help you create data visualizations.
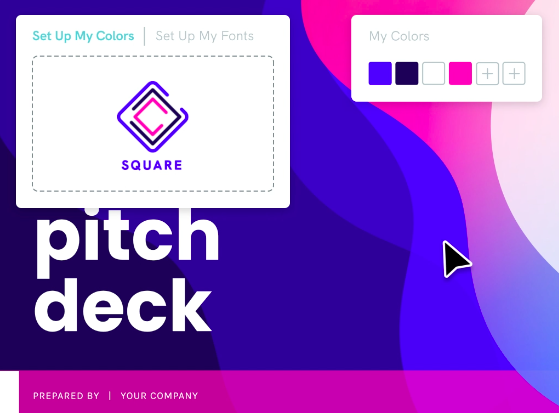
Another unique feature of Piktochart is that it allows you to customize your designs to fit your brand’s colours. For instance, you can upload your brand’s logo, and the tool will adopt the colours of your logo for your design, be it a pitch deck or a presentation.
Mind the Graph
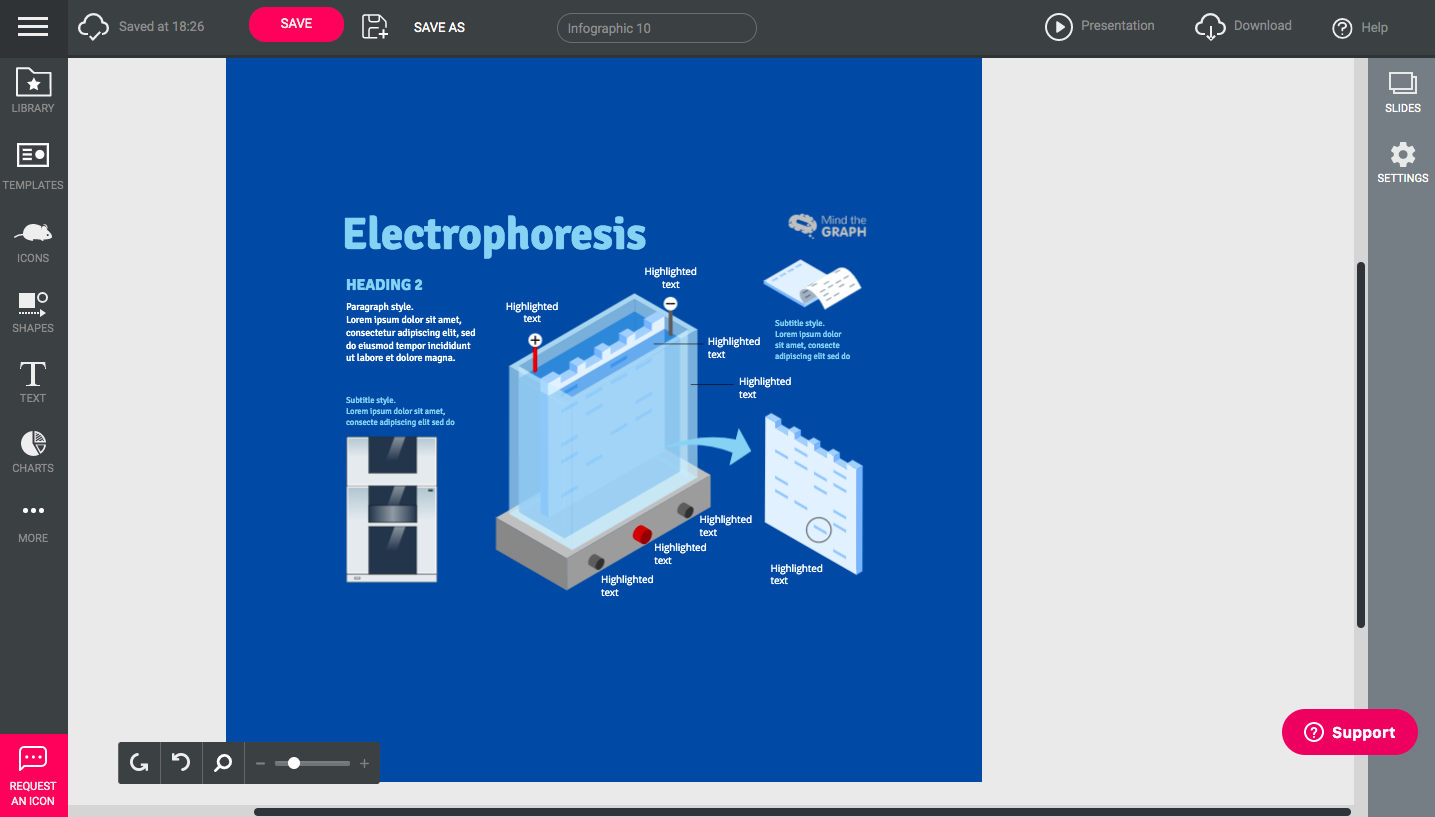
One of the top Piktochart alternatives, Mind the Graph is also unique in its own way. One of the most striking features of Mind the Graph is the on-demand illustrations.
Yes, you heard that right! If you are looking for a specific illustration for your designs, be it an icon or an image, you can simply request the illustration. And the people behind Mind the Graph will get it designed for you.
Another factor that makes MidnTheGraph stand out is its massive library of scientific illustrations.
You’ll get access to 40,000 accurate scientific illustrations that you can use for scientific posters, presentations, graphical abstracts, and many more.
Scientific illustrations and graphics are extremely difficult to find, and with Mind the Graph, users get access to pretty much any scientific illustration or use the on-demand illustration option.
Verdict
In terms of uniqueness, Mind the Graph, again, wins over Piktochart. The on-demand illustrations and the scientific library make it hard to overlook this great free alternative to Piktochart.
Features – Mind the Graph vs. Piktochart
Features are, of course, one of the topmost important things to consider in any design tool. Without the right features, you wouldn’t be able to create designs as per your needs, no matter the other factors.
Our in-depth research reveals that both Piktochart and Mind the Graph have some amazing and exciting features that will make your design process a delight rather than a drag. Let’s discuss the features of both these tools in-depth.
Piktochart
Piktochart has got some excellent features catering to design needs from various industries such as Human Resources, Marketing, Finance, and Healthcare.
Templates
The wide variety of pre-made templates are what make Piktochart one of the most popular design tool options. As soon as you sign up for the tool, you’ll get ready to use templates for the following types of designs:
- Infographics
- Presentations
- Posters
- Reports
- Fliers
- Social media graphics
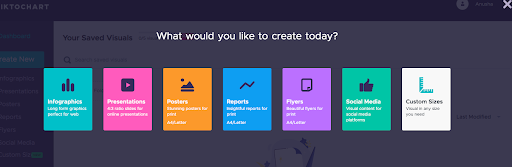
When you opt for one of these designs, you’ll get a wide array of templates to choose from. You can simply select a theme and start editing it based on your requirements.

Branding
As discussed before, one of the most desirable features of Piktochart is the ability to customize your designs for your brand colors within seconds.
You can simply upload your brand logo and drag-and-drop it on your design. Based on your logo, you can instantly change your design’s fonts and colours.
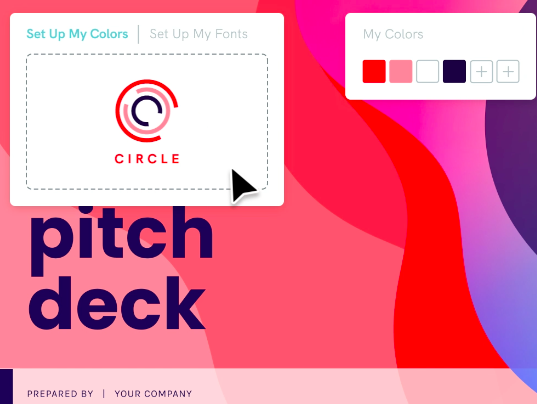
This cuts down the process of selecting your brand colors in the tool and then manually changing the colors of your designs based on your brand’s color palette.
The process might especially get tedious when you use a pre-made template that has 4 to 5 colors that you’d want to replace.
After this, your custom color palette and fonts will always be available for you to edit your designs. This feature comes in extremely handy for designers who deal with multiple brand logos or for marketers who deal with multiple brands.
Data Visualization
Data visualization is another cool feature about Piktochart that helps you upload data to the tool and create custom visualizations based on this data.
When you deal with HR tech or finance industries, where data visualizations are extremely important, a lot of your time may be wasted in uploading data and creating analytical dashboards and custom graphics.
A tool like Piktochart will save your day.
Piktochart allows you to upload raw data from Excel or Google Sheets.
You can connect your data with Piktochart, and the tool will come up with various kinds of visualizations such as pie charts, bar graphs, scatter plots, and similar more illustrations.
Using Piktochart, you can even make use of dynamic data.

Industries
Piktochart caters to professionals from various industries and does justice in helping us with designs for each of these industries. The tool has solutions suitable for finance, health care, human resources, and marketing professionals.
Piktochart has been the go-to tool for thousands of professionals from these industries and has given them some great results.
Mind the Graph
Mind the Graph gives Piktochart tough competition in terms of features. It has some really amazing, unique features that you must watch out for.
Templates
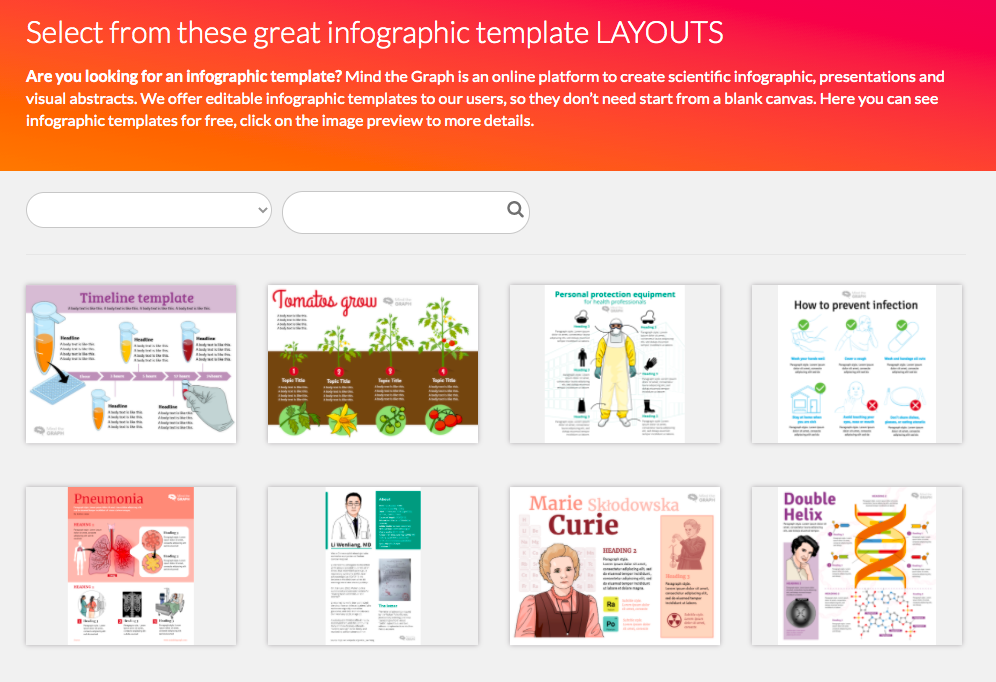
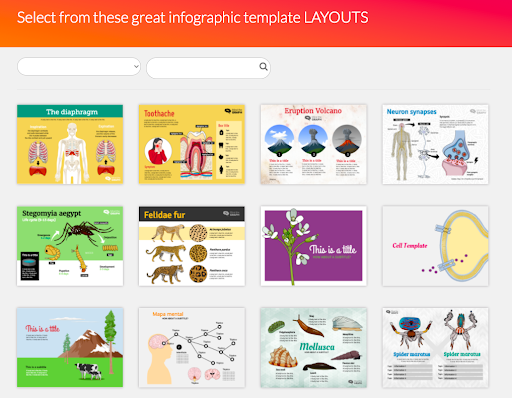
Mind the Graph has a big library of pre-made templates to choose from. With a simple search, you’ll be amazed by the number of templates available for your designs. So, you don’t necessarily have to start from a blank canvas – this makes things much easier.
Using Mind the Graph, you get templates for the following types of designs:
- Infographics
- Posters
- Presentations
- Graphical abstracts
Apart from these options, you can also start from a custom design template with the size of your choice. You also get some useful templates for figures, images, timelines, cycles, and processes.
World’s Largest Scientifically Accurate Illustrations Library
If you’re into designing scientific infographics, posters, or presentations, you know the struggle of finding some good online copyright-free illustrations is real.
You may take hours to find good illustrations to add to your scientific designs.
Mind the Graph comes to your rescue here as it comes with a gallery of whopping 40,000 scientific illustrations. In fact, it is one of the largest scientifically accurate illustrations library.
So, you’d most likely find all the illustrations that you’re looking for inside MidnTheGraph.
Another great feature here is the option to customize these illustrations.
Don’t you like the colour of the illustration that you picked? Cool, just opt for some other version of the illustration that you like better.

On-Demand Illustrations
As mentioned before, what makes Mind the Graph one of the best alternatives to Piktochart is the on-demand illustrations feature.
This kind of on-demand support is a rare feature to find in most of the top graphic design tools available in the market.
Though we are pretty sure that Mind the Graph’s massive library with 40,000 illustrations will suffice your design needs, you might still feel the need for some new illustrations that you’d like to add to your designs.
For such situations, all you need to do is let the Mind the Graph support know about the illustrations that you exactly need, and they’ll custom make it for you!
Exclusive Content for Scientific Community
The community of Mind the Graph users largely consists of researchers, scientists, and PhD students. This is because of the exclusive scientific content that Mind the Graph offers you.

Whether you are a researcher struggling with designs for your research paper’s graphical abstracts, or a healthcare professional who has given up on finding the right illustrations to add to your next big presentation, Mind the Graph is exactly the tool you’ve been looking for.
Complete Authorial Rights with Premium Version
The main problem with niche designs and illustrations is that they come with copyrights. So, it is not as easy as using Google to find illustrations for your designs and using them without a thought.
Mind the Graph provides you authorial rights for all the illustrations and exclusive designs available within the tool. This comes with the premium feature of the tool.
You’ll have Creative Commons licenses for your creations, and you can even transfer the authorial rights to third-party publishers without previous consultation from Mind the Graph.
Verdict
To conclude this section, we can say that Mind the Graph has some pretty good, not-to-be-found-anywhere-else features. However, the features of Piktochart are more in number, and they exceed our expectations.
Pricing – Mind the Graph vs. Piktochart
Pricing is another very important consideration when it comes to picking your design tool. Especially if you are looking for a design tool to work on for recurring projects, you need a tool that is affordable and fits in your budget.
If you’ve been looking for Piktochart alternatives that are free or more affordable, then Mind the Graph would be your best bet. Let’s look into the different pricing plans of both these design tools.
Piktochart
Piktochart has a free version as well as paid versions starting from $0, ranging to $99 per month.

Free
Piktochart’s free plan offers you 5 visuals each month along with access to their entire templates library. It also offers storage and image exports, but your designs will have the Piktochart watermark.
Pro
The pro version of Piktochart might be the best for individuals with a price of $29 each month. You get unlimited visuals, extra storage, the ability to create your color schemes and upload your fonts, and you wouldn’t have to worry about the Piktochart watermark.
Team
If you’re a team of fewer than 5 people, then you should go for this plan starts at 99$ per month. You get all the Pro plan’s features along with features to easily collaborate with your team on multiple projects.
Custom
If you’re a team of more than 5 members, then you might want to contact the people at Piktochart and get a custom priced plan for your requirements.
Education/Non-Profit
Piktochart also has specific plans for educational and non-profit organizations. Both these come with a Pro plan at $39.99 a month and a Team plan at $199.95 a month.
Mind the Graph
Mind the Graph has a free version as well as paid versions starting from $0, ranging to $59 per month.

Beginner/Free
The Beginner of the free version of Mind the Graph comes with features similar to the free version of Piktochart. You get up to 4 visuals, 1 editable figure, and 1 external file upload.
Visuals designed using the free version of Mind the Graph will consist of their watermark. Mind the Graph is one of the best free alternatives to Piktochart.
Junior
The junior plan of Mind the Graph is one of the most budget-friendly design tool options present in the market.
You get 10 illustrations and exclusive access to their massive illustrations library at a price of just $5 a month that is a pretty affordable price. Plus, you also get one free on-demand illustration each month.
And that is why Mind the Graph is one of the most sought after Piktochart alternatives available in the market.
Senior
Mind the Graph’s senior plan is priced at $9 a month, and with this version, you get unlimited visuals, editable figures, and, of course, access to their library of illustrations. You also get 5 on-demand illustrations each month with the Senior plan.
With the Senior plan, you get extra perks like requests for new template styles, tips and support from the Mind the Graph’s design and infographics team, and priority customer support.
ProTeams
For 10 simultaneous users, you can opt for Mind the Graph’s ProTeam plan. You get all the features from the Senior plan along with 50 on-demand illustration requests each month. You also get the option to collaborate with your team and exclusive access to Mind the Graph’s design team.
Verdict
To sum it up, we can say that Mind the Graph is the clear winner when it comes to affordability. You get access to exclusive icons, illustrations, and images and up to 10 custom visuals without any watermark at an amazing price of $9 a month.
So, we can confidently say that if you’ve been searching for more affordable alternatives to Piktochart, then Mind the Graph would be your go-to design tool.
Pros and Cons
Now that we’ve discussed in detail how Piktochart and Mind the Graph tools differ in terms of features, uniqueness, usability, and pricing, we can sum it all up in this pros and cons section.
Here, we’ve objectively broken down the pros and cons of both these tools based on extensive research to make things easier for you.
Pros and Cons of Mind the Graph
Pros
- Mind the Graph scores high on usability. The tool is extremely intuitive, and you wouldn’t need any extra time to figure out the ways of working with this tool. Easy tool-tips to guide you through the design process and options to drag-and-drop illustrations of your choice make it a no-brainer option.
- Mind the Graph has the world’s largest library of scientifically accurate illustrations – something that is rare to find. You get access to all of their exclusive content at prices as low as $5 a month.
- The on-demand illustrations feature can be one of the top reasons to pick this Piktochart alternative. Though their massive illustrations library would suffice your design needs, you may request free illustrations from the Mind the Graph team if you need anything specific for your designs.
- Mind the Graph has a huge variety of templates, to begin with, so you do not have to go through the anxiety of starting a complex design from the start. You can use their pre-made templates and get your designs done in a matter of minutes.
- With the premium version of Mind the Graph, you get exclusive access to their design team and premium support, which is a nice feature to have.
- Another notable factor that is the highlight of Mind the Graph is its affordability. Whether you are an individual or an organization looking to collaborate with your team, Mind the Graph is extremely budget-friendly for all the amazing features it offers.
Cons
- One of the cons of Mind the Graph is that it doesn’t come with a data visualization feature. You can create charts and graphs by manually adding data. But you cannot connect the tool with Excel or Google spreadsheets. If you are an individual or a team in need of a tool that automatically converts your data into visuals, the Mind the Graph may not be the right pick for you.
- Another con about Mind the Graph is that it doesn’t offer you options to create your own color schemes and upload your fonts and use it for all the designs.
Pros and Cons of Piktochart
Pros
- One of the biggest pros of Piktochart is its wide library full of templates available for different types of designs such as posters, infographics, social media graphics, and many more. Getting down with your designs is pretty easy when you make use of these templates.
- Piktochart offers you data visualization that allows you to connect an Excel or Google spreadsheet to upload your data. The tool automatically generates charts and graphs customized to your data – something that makes Piktochart one of the tops picks for professionals dealing with data.
- Branding with Piktochart is pretty simple. You can upload your brand logo, and the tool will capture your brand’s colors and fonts for all your future designs.
- With Piktochart, it is very easy to collaborate with your teams and get your designs done within no time.
- Piktochart caters to professionals pertaining to different industries such as health care, marketing, finance, and HR. They also have pricing plans for educational and non-profit organizations.
Cons
- For a beginner who is new to design, Piktochart may come with a steep learning curve because of the overwhelming number of options available in the tool. Designing custom graphics from scratch may seem difficult to start with though it is easy to get the hang of it once you begin using the tool more frequently.
- Though Piktochart consists of a huge library of illustrations, there is no option to request any illustrations that are not available in their library.
- The price of Piktochart is more towards the higher end. If you’re an individual or a start-up looking to publish more infographics, you may find yourself looking for some Piktochart alternatives that are free and more affordable.
Conclusion
There you have it – a comprehensive look into Piktochart and Mind the Graph design tools. We have made sure to keep the comparison to be as objective and authentic as possible so that you get a 360-degree view of the pros and cons of both these excellent tools.
If you’re looking for a design tool that is one the best, no-brainer Piktochart alternatives, then you must opt for Mind the Graph. Mind the Graph is trusted by researchers and academics from the top 100+ academic, educational, and industrial institutions.
The pro version of Mind the Graph starts at $5 a month which is largely affordable compared to that of Piktochart that starts at $29 a month.
With Mind the Graph, you can get access to some exclusive scientific content that is extremely rare to find on the internet. You should definitely try Mind the Graph’s free version to know for sure if the tool works for your requirements and design goals.


Subscribe to our newsletter
Exclusive high quality content about effective visual
communication in science.