This tutorial video shows you how to create an infographic on Mind the Graph. The infographic templates to our users so they don’t need to start from a blank canvas. Is the best way to save time and create something eye-catching.
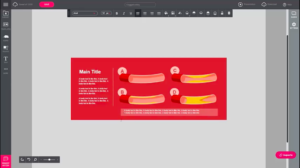
Learn in the tutorial video below how to create an infographic in Mind the Graph. The topic of the week is “four steps” infographic.
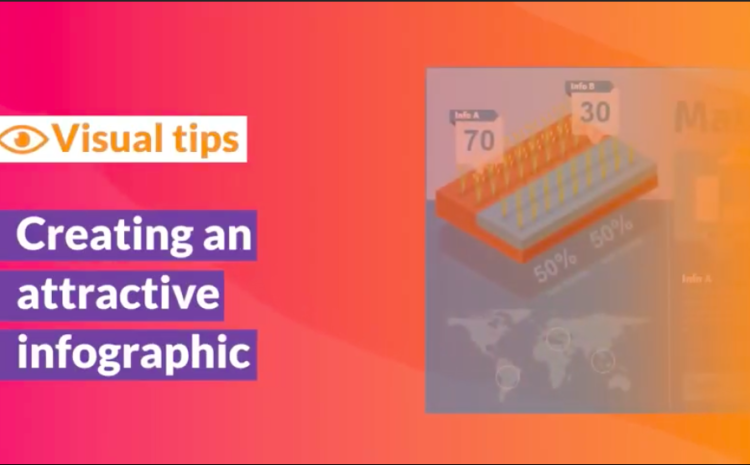
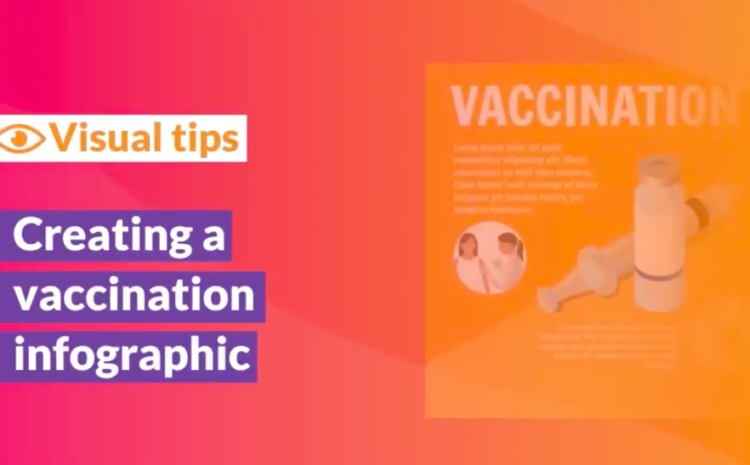
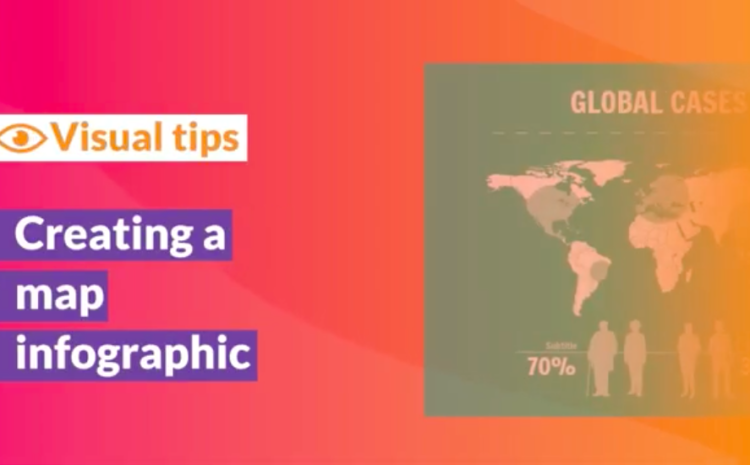
Tutorial video on how to create an attractive infographic with scientific illustrations on Mind the Graph, the infographic maker for scientists and academics. We turn scientists into designers to boost their impact!
- If you liked the video, access Mind the Graph Youtube Channel for weekly updated
- – “Visual tips” playlist for tutorial infographic videos:
- – “How to” playlist for tutorial videos on how to use Mind the Graph features
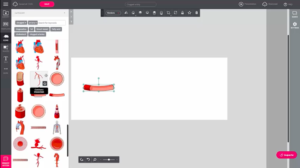
It is very simple to use the infographic maker as you can see in our tutorial video.
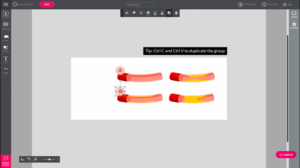
Choose the best illustrations from your field, change colors and background and create an unique and beautiful infographic. The tutorial video has visual tips to help you use colors, illustrations and charts to turn your data into visuals that tell a clear story.
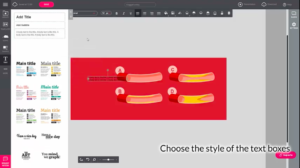
If you are a subscriber just go to our gallery and choose the best template for you, click on it and start to create your infographic. Also you can select a template inside your workspace. This way you can try different styles and select your favorite. If you aren’t a subscriber, you can use the templates as an inspiration to your creation or invest a few dollars to have access to all mind the graph features.
Mind the Graph is an online platform to create scientific infographics, presentations and graphical abstracts. Learn how to use the different illustrations in your graphical abstract.
To see more beautiful templates: https://mindthegraph.com/templates/
To start using Mind the Graph for free: https://mindthegraph.com/
To learn how to make an infographic: https://goo.gl/MYBmRd.

Subscribe to our newsletter
Exclusive high quality content about effective visual
communication in science.