Have you ever had difficulty choosing the most appropriate journal for your paper? The selection of the most relevant journal to target can be overwhelming for any researcher looking to publish an article. It doesn’t have to be.
Research is increasingly grounded on the basis of certain metrics. A journal’s matrices provide important information about its impact and relevance in its many fields of research – if not all of them. As the number of sources of information has increased, finding the most effective ways to reach your target audience is becoming more key.
To be sure that your choice of journal is the best, browse its metrics before selecting one. Metrics will surely help you decide on which journal to use. The Journal Impact Factor, for example, will give you an indication of which journal to submit to.
The number of impact factors a journal has is easy to find, but actually understanding those numbers is quite another matter. The following is a guide that makes journal impact factor simple to understand. Among other things, we will discuss what it is and also list the journals and their impact factors to help your decision.
What is research journal impact factor?
An impact factor (IF) is an indicator of how frequently a particular article in a journal is cited during a given year. Annually, Clarivate Analytics offers Web of Science Journal Citation Reports which include Journal Impact Factors.
Impact Factors are only allocated to journals that are included in the Science Citation Index Expanded (SCIE) and the Social Sciences Citation Index (SSCI).
Research Journal Impact Factor enables users to assess and categorize academic journals for quality and excellence using quantitative and qualitative techniques.
Research journals with high-impact factors tend to be more well-regarded. Eugene Garfield, the founder of the Institute for Scientific Information, first introduced this concept.

Many organizations and clinicians utilize journal impact factors, but they are unaware of the method for calculating them, their importance, and how they are used.
There are a number of journals that publish more reviews or review articles that will result in a higher impact factor. As Eugene Garfield noted, the impact is simply a function of how well journals and editors attract the best papers to their journals.
It then becomes a question of how the impact factor is calculated , and how do you find the right journal with a good impact factor? Let’s take a closer look at these really important factors.

How is a good Research journal’s impact factor determined?
Is there anything you can tell me about a good journal’s impact factor? Is the answer 5 or 99? There is no fixed numerical answer to this question for every journal.
Generally speaking, impact factors are used to determine the relative importance of a journal in its niche and refers to a measure of how frequently an article in a journal has been cited within a specified period of time.
Citations earned by a wide range of scholarly journals are used to calculate impact factors for Clarivate Analytics. Journal Citation Reports (JCR) computes the yearly Journal Impact Factor by aggregating all citations attributed in a single year to articles published by a journal in the two preceding years.
To calculate the 2022 Journal Impact Factor for a journal, all citations to its 2020 and 2021 articles must be counted. After dividing the total by the number of articles cited in the journal in those years, we arrive at the JIF for the current year (2022), which is published in 2023.
Calculation of 2022 Impact Factor of a journal
A = the frequency of articles published in 2020 and 2021 and were cited by indexed journals during 2022.
B = the total amount of “citable articles” published in 2020 and 2021.
A/B = 2022 impact factor
Therefore, this question arises again, what is a good impact factor for a research journal? There is no simple answer as it varies by journal type and discipline but we can raise some average conclusions.
What is a good impact factor for a research journal
In the sciences, where citations are more rapid and frequent than probably in other fields, a journal with a JIF near 350 will receive an exceptionally high number of citations. In many fields of study, impact factors of 10 or above are considered exceptional, and in some, it is above 3. However, Journal Citation Reports(JCR) impact factors for journals differ significantly from one discipline to another.
The following factors should be considered when evaluating impact factors:
- Date of Publication: Impact factors are calculated by counting the number of citations that an article receives within a short period of publication date. As a result, journals in fast-growing fields like life sciences and technology have higher straight away citation metrics and correspondingly higher Impact Factors. For purposes of calculating the denominator, only research papers or articles and reviews articles that are cited are considered.
- Impact factors are not calculated for articles cited in journals not included in the Web of Science database.
- Review Articles: Review articles, articles of opinion, letter pieces, and news articles are not included in the total number of articles; if cited, they will still count as citations for the journal. In some cases, this could lead to boosted impact factors through alteration of ratios used to calculate impact factors.
- Journals with a low citation count are usually clinical journals. Consequently, such journals suffer from citation points that are lower than those of other journals in their similar subject areas.
- For the first year following the title change of a journal, the Impact Factor for the journal is zero since the number of articles published in the two years prior to the title change is zero. The same applies to new journals added to the database of JCR.
- There is an uneven distribution of coverage since the Journal Citation Reports concentrate on subjects where journal articles are primarily published. As a result, it does not provide much coverage of the Humanities and Social Sciences, which rely more on book formats and other formats of publishing.
An impact factor for a journal in a specific subject category can be determined by comparing it with other journals in the same JCR subject category.
In order to achieve this, you must go to the JCR website on the InCites platform and click Browse by Category. On this page, you’ll find subject classifications ranked by the number of journals in each category.
It is also possible to compare all the journals in a subject category with the Journal Impact Factor, and you can also select particular journals to compare by using the options from the menu. Let’s explore some tools that can be used to calculate journal impact factors.
Journal Impact Factor Measurement Tools
We now know how the calculation is done, so let’s find out where it can be done. The tools listed below are all standard tools and give the most prominent impact factor for journals of various fields.
Journal Citation Reports
Rankings for scientific, technological, and social sciences journals are provided by Journal Citation Reports. Each journal included in the database includes the following information: 1)Citation figures and article numbers, 2) Impact factor, 3) Cited half-life, 4) Immediacy Index, 5) Source record listing, 6) Citing journal listing, 7) Cited journal listing, 8)Research categories, 9)author information.
This database only includes citation data from journals indexed by Web of Science. More than 12,000 journals in arts, literature, sciences and social sciences are indexed.
Using the menu, select a JCR edition (Science or Social Science), year, and Category to determine the impact factor for that journal. Press submit to retrieve the impact factor.
Click on the journal of interest to retrieve the impact factor. There are four ways of classifying the list: by Journal time, by Cites, by Impact Factor, and by Eigenfactor.
Scopus (Elsevier)
Using Scopus Journal Analyzer, you can also evaluate ten journals within one subject area before submitting your manuscript. The Scopus database contains abstracts and citations (bibliography) published by Elsevier.
A Scopus Journal Analyzer does citation analysis for more than 20,500 titles in science, technology, life sciences, and social sciences. These citations date from 1996. Every two months, Scopus updates its database.
As a result of Scopus’s Journal Analyzer, you can determine three metrics about journal performance: CiteScore, SJR (SCImago Journal Rank), and SNIP (Source Normalized Impact per Paper).
SCImago Journal Rank (SJR)(Elsevier)
The SCImago Journal & Country Rank is an online tool that includes journals and country scientific statistics based on data from the Scopus® database (Elsevier).
More than 10,000 journals are available through Scopus from over 4,000 international publishers, including more than 1,000 open access journals.
This database contains citation details from over 34,100 article titles from more than 5,000 publishers worldwide.
It also includes country-specific impact metrics from 239 countries. You can also integrate significant journal metrics into your page as a clickable image widget through the SJCR.
Eigenfactor
In January 2007, Carl Bergstrom and Jevin West co-founded the Eigenfactor®. University of Washington’s West Lab at the Information School and Bergstrom Lab in the Department of Biology sponsored this project.
A journal’s Eigenfactor score is a measure that is intended to indicate how widely a journal is used. Accordingly, they are supposed to represent how often an ideal researcher would access material from that journal.
Furthermore, the Eigenfactor score changes as a function of journal size, increasing by two-fold with an increase in the number of articles per year published by the journal.
A journal’s Article Influence Score measures the average impact of its articles, which makes it akin to a conventional impact factor.
SNIP (Source Normalized Impact per Paper)
The SNIP project was founded by Professor Henk F. Moed of the Centre for Science and Technology Studies at Leiden University.
In Source Normalized Impact per Paper (SNIP), citation impact is measured by weighting citations according to the volume of citations in a particular subject area. Source Normalized Impact per Paper is calculated annually using Scopus data.
In subject areas with few citations, a single citation holds greater significance, and the reverse is also true. Incorrect citation practices are corrected for by SNIP, making comparisons of citation impact more accurate across fields.
H-index
H-index measures a writer’s scientific research output at the level of his or her authorship. This index evaluates the scientific contribution of a scientist while simultaneously evaluating their impact.
This is defined as the largest number for which the author has been cited so many times in so many of his papers. For example, if an author has a h-index of 5, then at least 5 of his papers have been cited at least 5 times.
With a h-index of over 20, an author can be considered an expert in their field. A journal’s h-index may also be calculated. This refers to the maximum number of papers published by the journal that have been cited a number of times in the past. Journals that have been around longer tend to have higher h-index.
CiteScore
The CiteScore of a journal is equal to the number of citations received by it in a particular year to articles published in the previous three years, dividing it by the number of articles indexed by Scopus from the same time period.
The citation impact of a journal is measured with Scopus’ CiteScore. This tool calculates metrics using Scopus data and is free to use. It contains more than 24,000 ranked titles covering more than 300 fields of study.
The CiteScore Tracker provides you with a way of keeping an overview of the performance of particular journals over the course of a year.
The impact factor of major research journals
Impact plays a critical role in understanding how a journal has performed over time and in determining its direction in the coming years.
The true picture of impact can never be achieved by using a single metric, so a range of indicators should be used to support the decision-making process. We’ve listed a few of the major journals with their impact factors below.
Here is how to improve impact factor through Visuals
For a journal to improve its impact factor, its articles must be of a high standard and cited frequently. In order to achieve that, the articles submitted must have elevated factors that make them stand out.
Increasingly, journals are asking for ‘visual abstracts’ along with articles when accepting submissions. The main findings of the article are required to be presented visually and in a comprehensive, concise pictorial summary.
You could choose to use the conclusion of the article or even better yet, a figure that communicates the essence of the article in a quick glance, such as an article-specific figure.
Articles with graphical abstracts have been shown to have a positive effect on both the view count of the article and citations, ultimately improving the impact factor of the journal.
It is significant to note that compared to articles without a visual abstract, it is estimated that the average amount of use per year has doubled for articles with a visual abstract.
In addition to increasing your paper’s citations, you will make it stand out by including an ample number of graphics. It has become increasingly common for researchers to include graphical illustrations in their research.
Using graphic illustrations as a way to communicate your research can be powerful and effective. Read our article on What is Visual Abstract and how to make one in the easiest way.
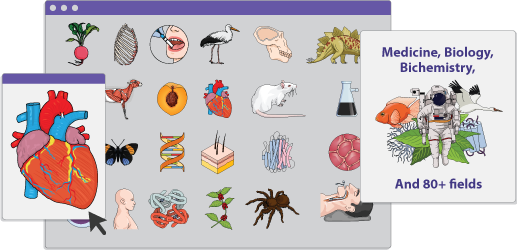
Nevertheless, you must ensure that illustrations and visual abstracts are not copied and pasted. How and where should you begin? You’ve come to the right place! With Mind the Graph, you can choose from an array of illustrations in multiple fields.
What’s even more fascinating is the fact that you will also be able to get it custom-made by our team of professionals if you so desire. We also post articles relating to science-related topics and other useful guides on our blog. If you’d like to take a look, click here.


Subscribe to our newsletter
Exclusive high quality content about effective visual
communication in science.