This tutorial video shows how you can create scientific charts in mind the graph. You won’t have to start from scratch. Thus, it will be easier to create something flashy and interesting to communicate your research, spending less time. We turn scientists into designers to increase their impact!
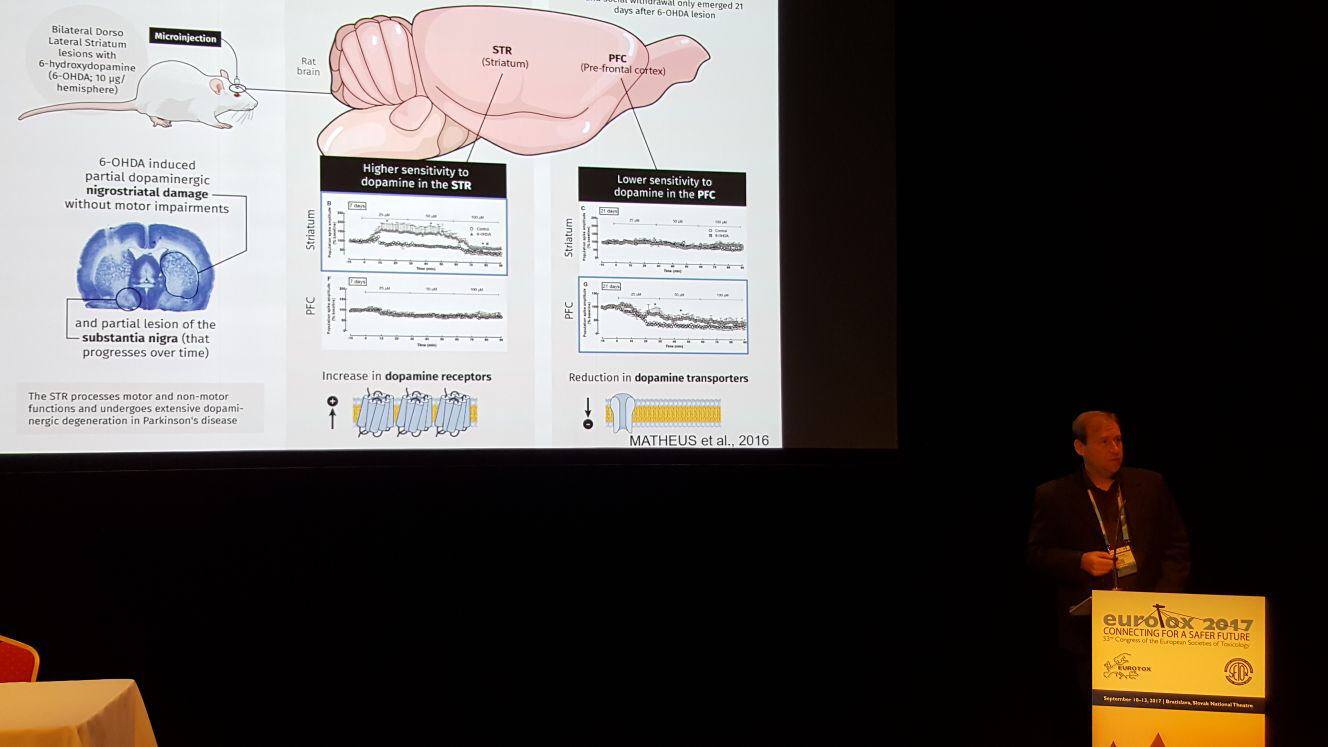
In addition to scientific figures, one of the most didactic ways of communicating our research is through scientific charts, whether they are pie, bars or lines. Therefore, in the video below we teach you how to create charts within the Mind The Graph platform, quickly and simply, adapting to your research.
- If you liked the video, access Mind the Graph Youtube Channel for weekly updated
It is very simple to create scientific charts as you can see in this video tutorial. But in addition, you can create your entire infographic on our platform. Choose the best illustrations from your field, change colors and background and it’s done!
So, if you are a subscriber just go to our gallery and choose the best template for you. Also you can select a template inside your workspace. This way you can try different styles and select your favorite.
If you aren’t a subscriber, you can use the templates as an inspiration to your creation or invest a few dollars to have access to all mind the graph features.
Therefore, the idea of the platform is that you can have TOTAL AUTONOMY to be able to better communicate your research. Thus, every inch of the image will have the necessary information.
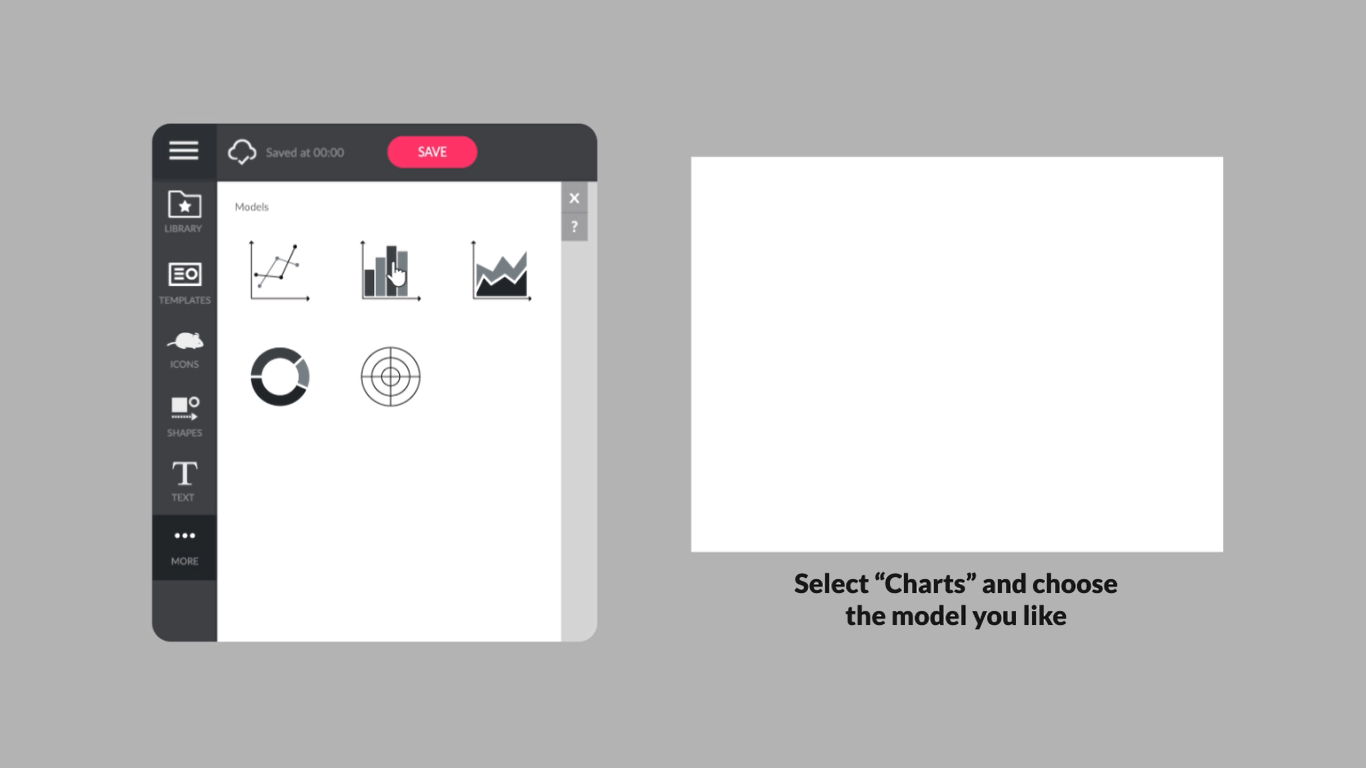
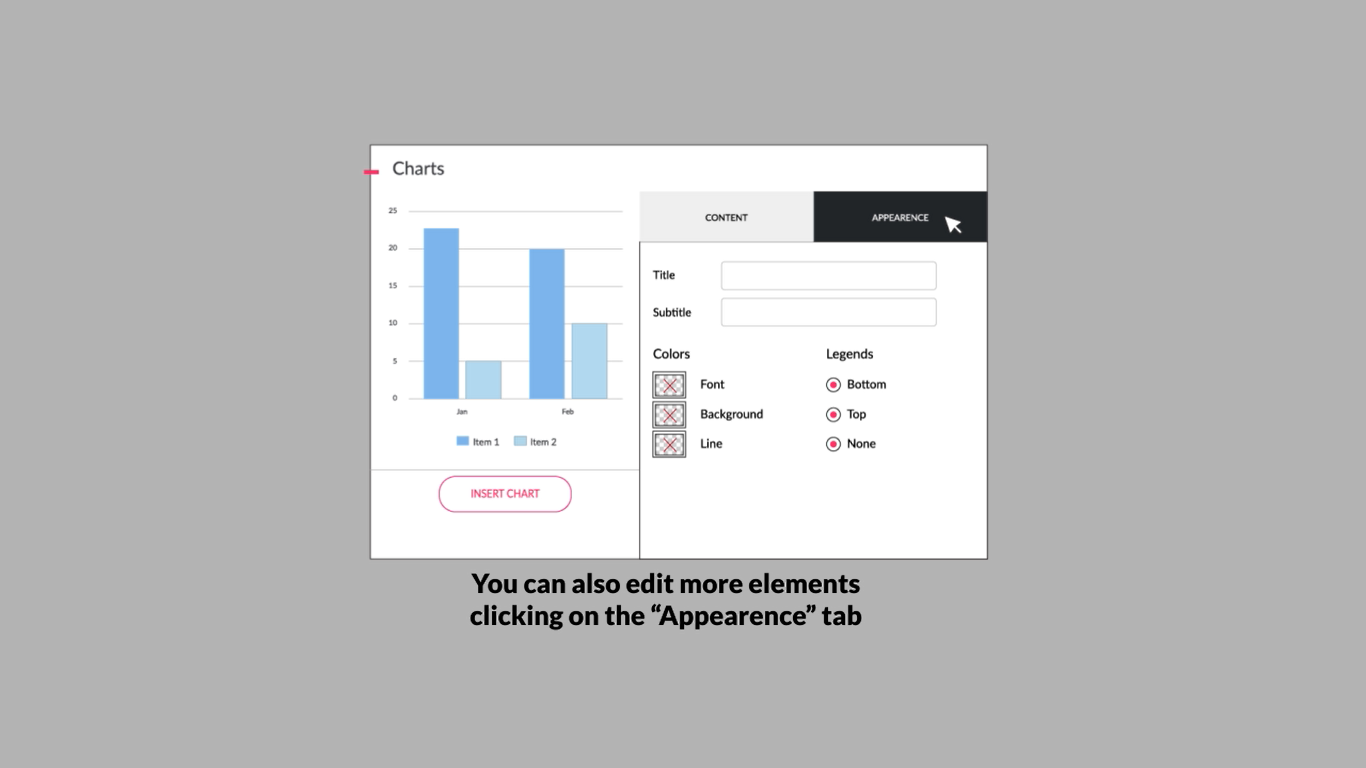
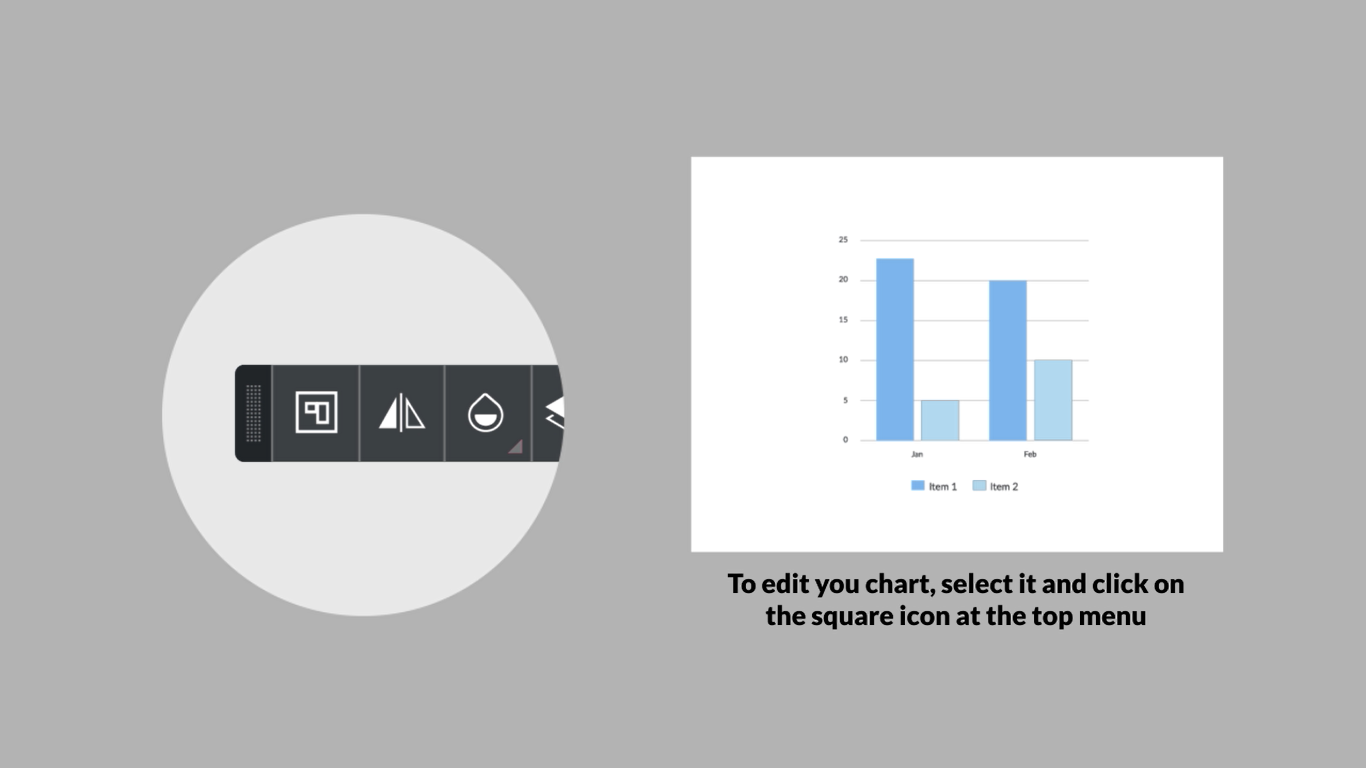
And if you can’t watch right now, don’t worry! We have separeted the main tips on how to create scientific charts below:

Mind the Graph is an online platform to create scientific infographics, presentations and graphical abstracts. Learn more about using the platform to communicate your scientific research.
- To see more beautiful templates: https://mindthegraph.com/templates/
- To start using Mind the Graph for free: https://mindthegraph.com/
- To learn how to make an infographic: https://goo.gl/MYBmRd.


Subscribe to our newsletter
Exclusive high quality content about effective visual
communication in science.