This tutorial video shows how you can create a effective charts in Mind the Graph. […]
This tutorial video shows how you can create scientific charts in mind the graph. You […]
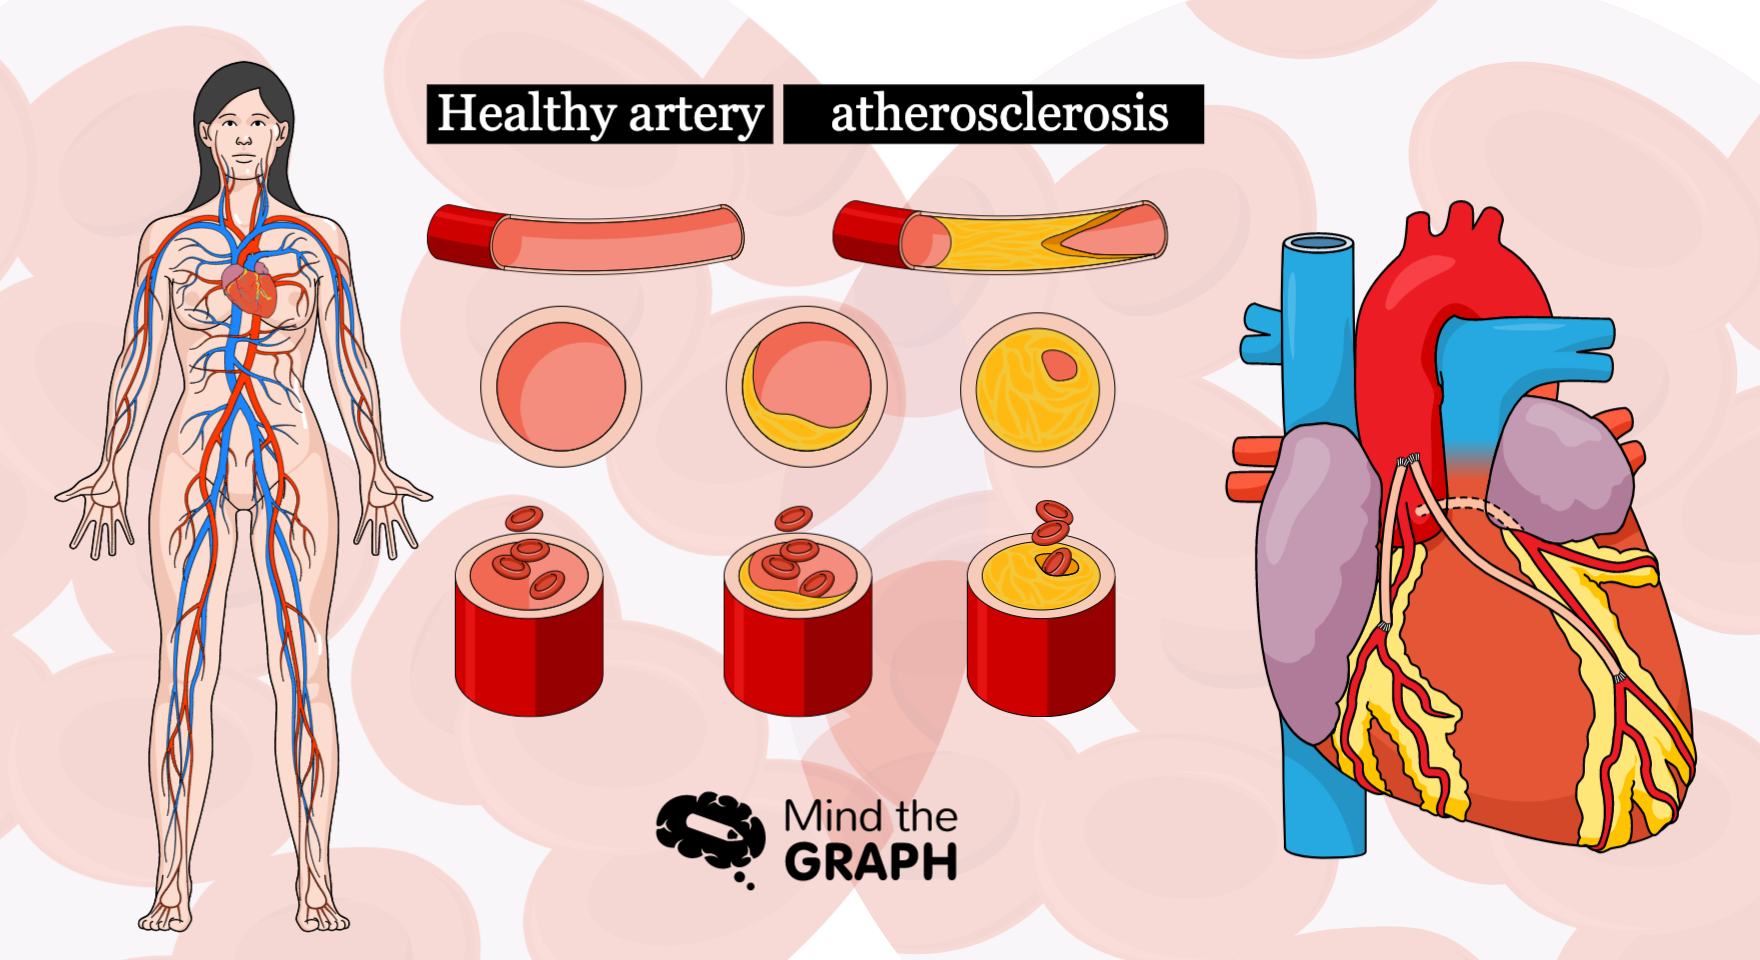
Atherosclerosis is a medical condition of the circulatory system. It happens when plaque accumulate inside […]
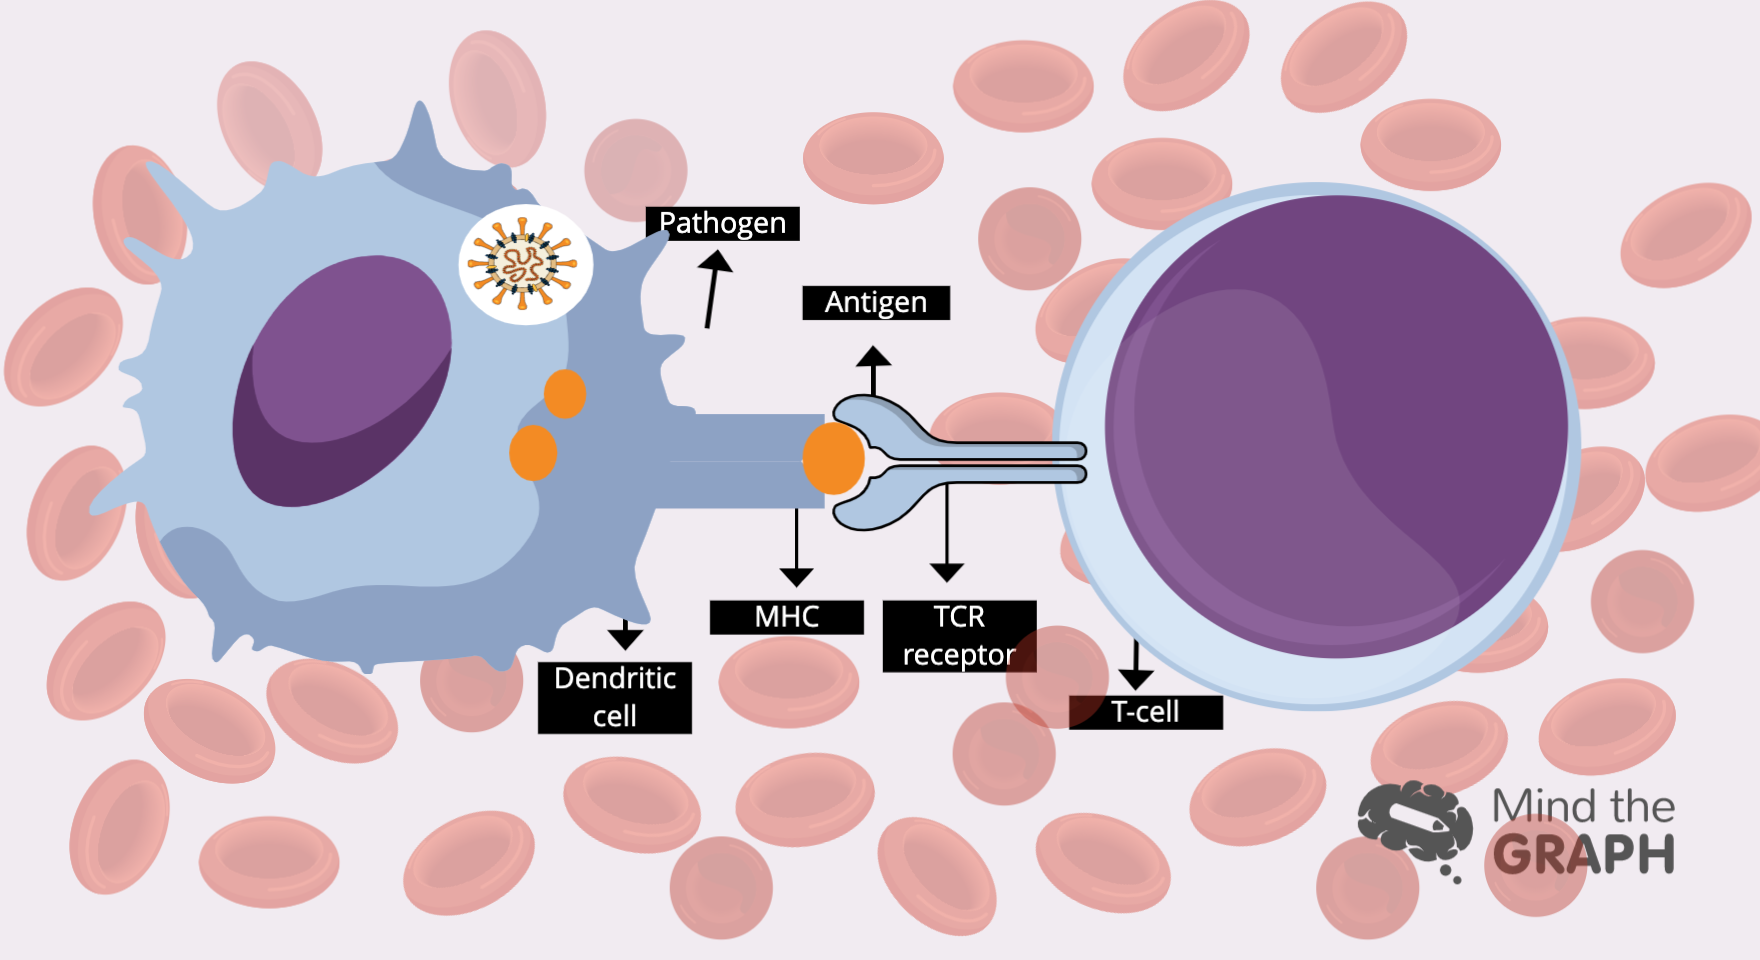
Os glóbulos brancos são responsáveis por defender nosso corpo contra ameaças, mantendo-nos vivos. Mas como […]
Hi there! Being a scientist means to be updated in everything about science. Even more, […]
Mind the Graph é uma plataforma com milhares de ilustrações científicas que permite criar resumos […]
It’s friday again (YAY), so it’s time to see the new scientific illustrations of the […]
As you know, every week we add new scientific illustrations to our library on Mind […]
As you know, every week we add new scientific illustrations to our library in Mind […]
Como você sabe, adicionamos novas ilustrações científicas todas as semanas no Mind the Graph. Assim, […]
Como você sabe, adicionamos novas ilustrações científicas todas as semanas no Mind the Graph. Já […]