As you know, every week we add new scientific illustrations to our library on Mind the Graph. We already have over eight thousands illustrations now. Moreover, all them are available to all mind the graph users. Most of our illustrations are made by requests from our subscribers. So, if you are a subscriber, you can request new illustrations at no extra cost. However, if you aren’t a subscriber yet, but you want to show your results in a visual way, don’t waste more time:

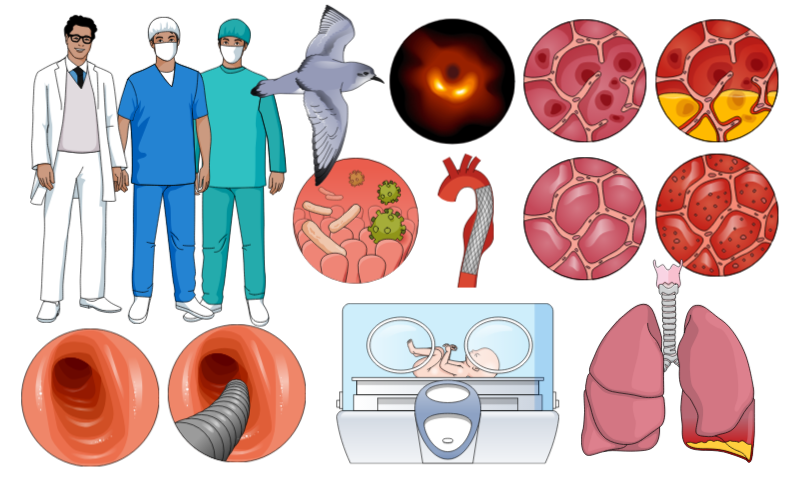
Take a look at the scientific illustrations of the week:
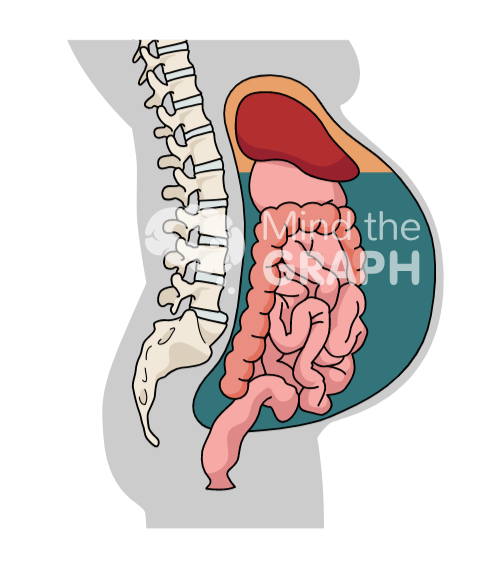
Ascitic fluid in the peritoneal cavity
“My illustrations look great, thanks so much! May I make another request? I need a figure showing the build up of ascitic fluid in the peritoneal cavity of patients with liver disease.”
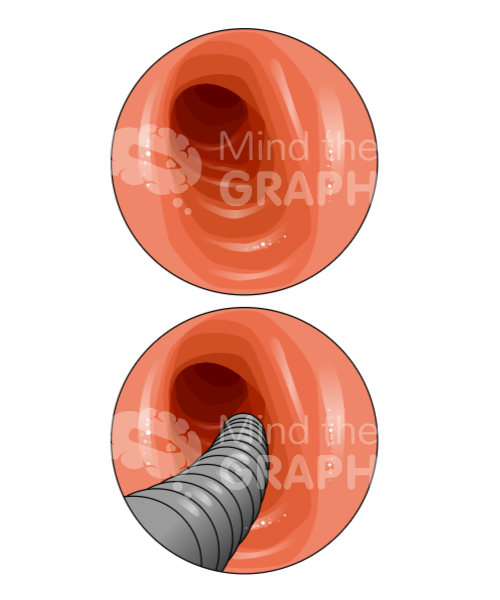
Endoscopy procedure
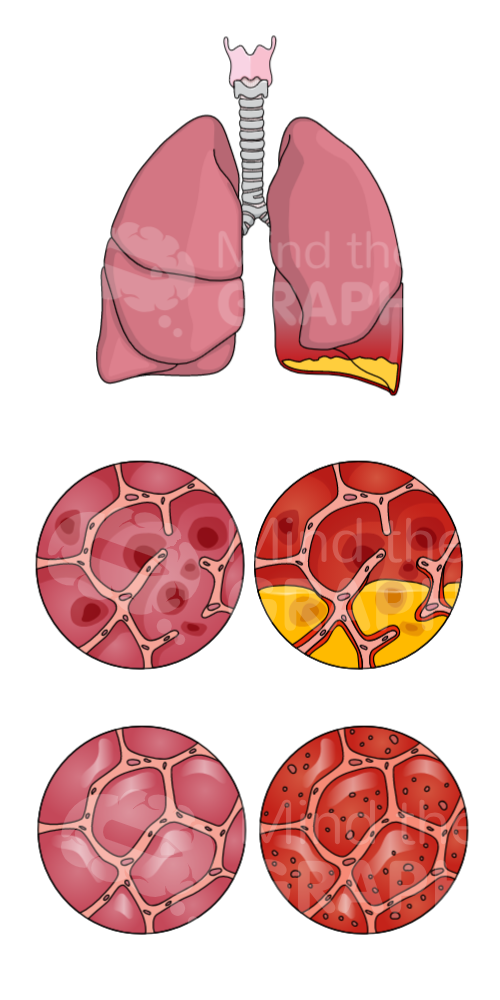
Disseminated/multifocal pneumonia
“Thank you for the pneumonia illustrations, I found them perfect for the paper I am writing.”
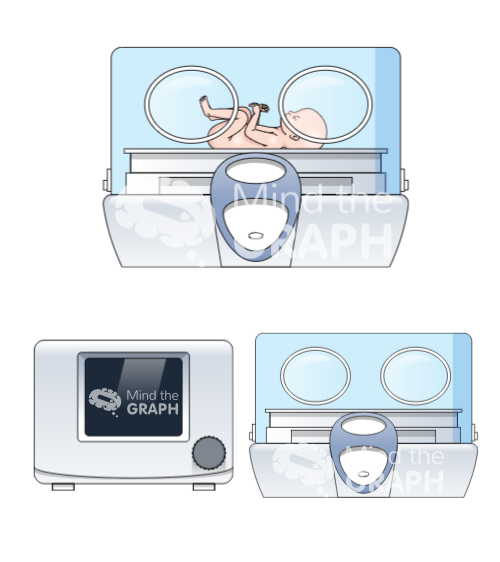
Newborn incubators and monitor
“I am working in a NICU, any icon of a term and preterm newborn, incubators, monitors would be appreciated”
Doctors

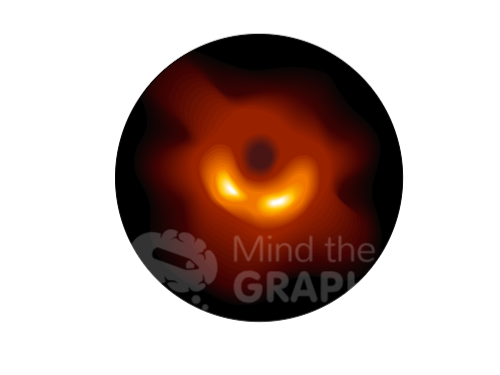
Black hole
If you want to use these illustrations and have access to our library with thousands illustrations create your account on Mind the Graph. We offer a free plan so you can start today to create better graphical abstracts:


Subscribe to our newsletter
Exclusive high quality content about effective visual
communication in science.