Mind the Graph supports student’s research initiatives in South America
Durante os dias 24 e 25 de outubro de 2019, aconteceu no Sindicato das Empresas […]
Durante os dias 24 e 25 de outubro de 2019, aconteceu no Sindicato das Empresas […]
Embrace yourself, the weekend is coming! It is friday again and we are waiting for […]
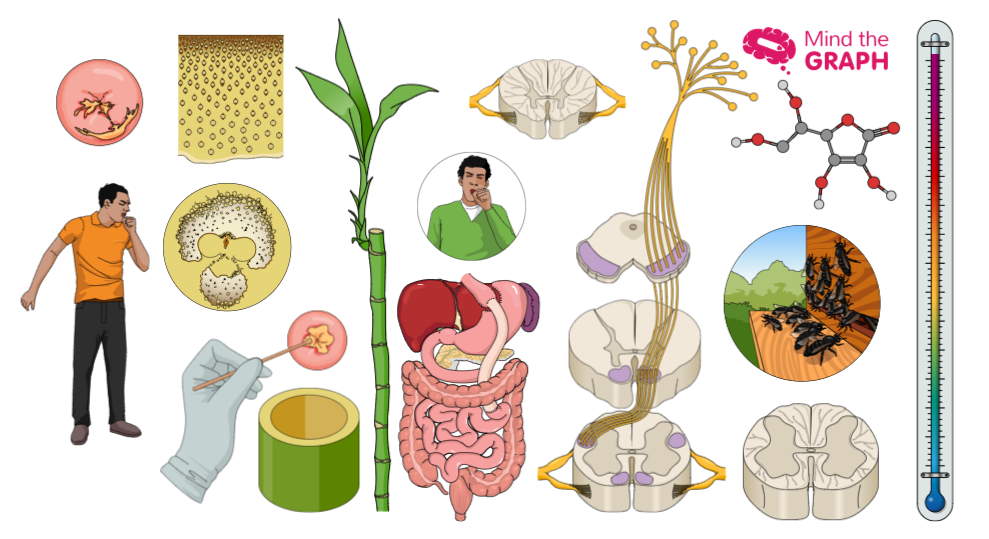
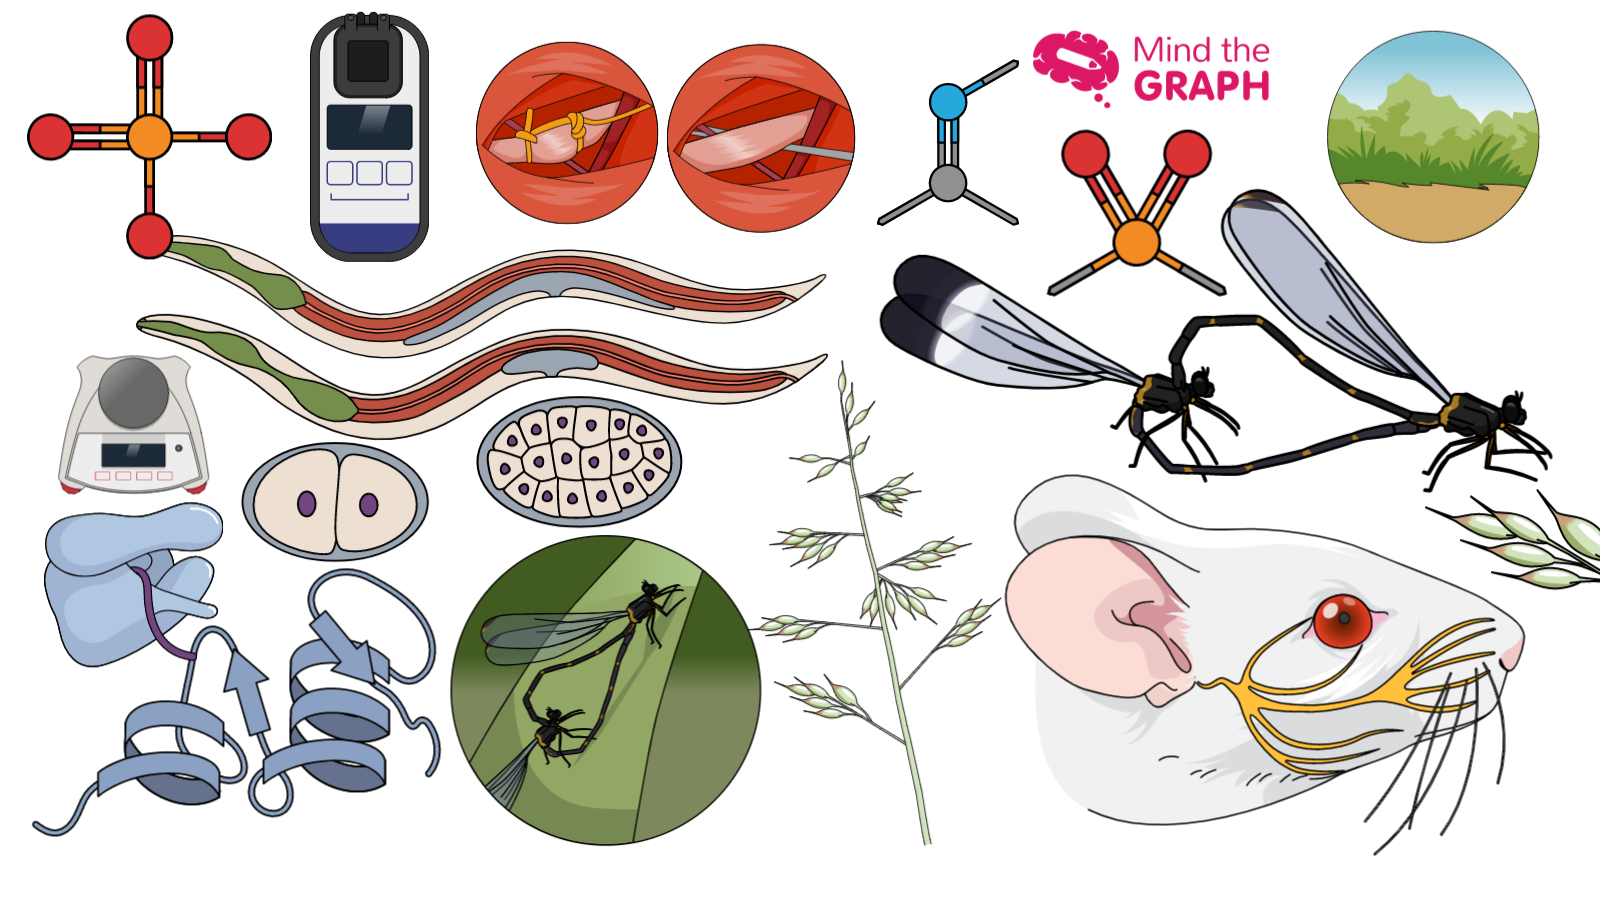
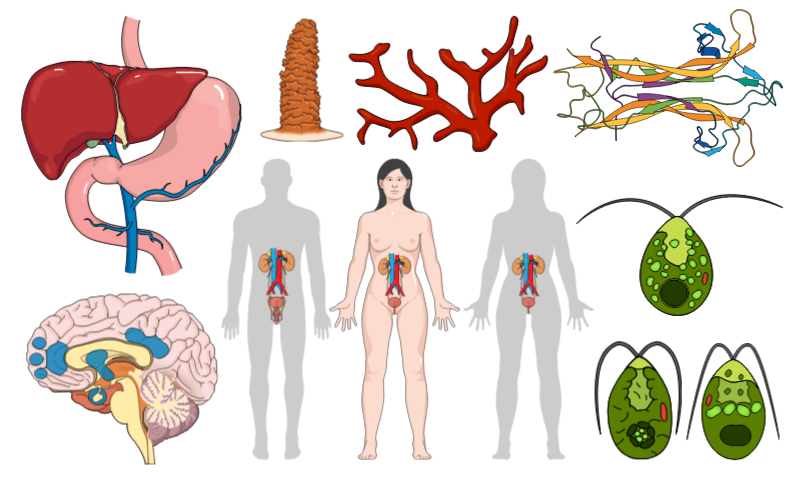
Hello, it is time to show the new Mind the Graph scientific illustrations. We already have […]
It is always amazing to show the scientific work of our users. So, today I will […]
Mind the Graph é uma plataforma com milhares de ilustrações científicas que permite criar resumos […]
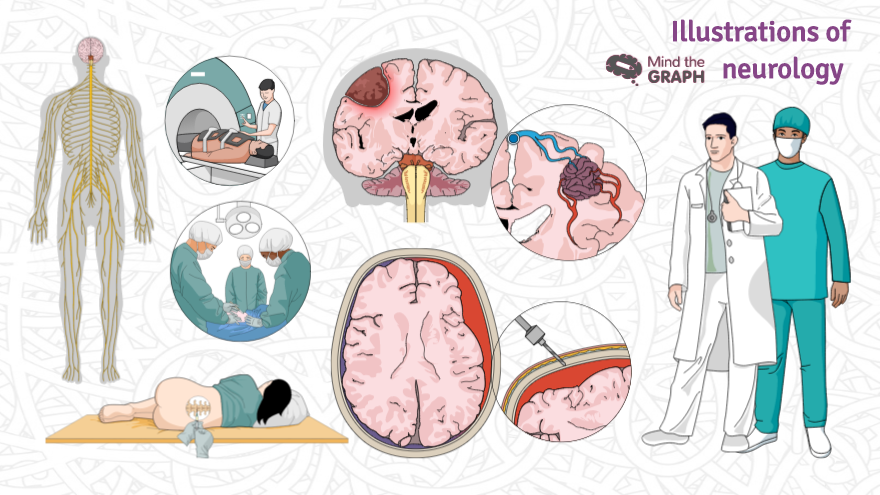
Os distúrbios neurológicos são doenças do cérebro, da coluna e dos nervos que os conectam. […]
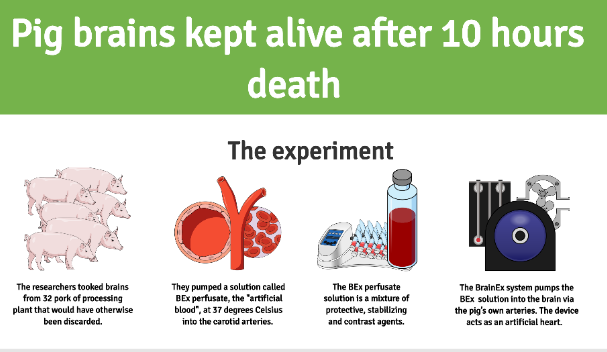
Scientists from Yale University kept pig brains alive outside body for hours after death. The […]
Hello, this week we’ve added amazing new scientific illustrations. All these illustrations are available on […]