A scientist work life isn’t just “wearing a lab coat and doing research”. We also have to deal with burocracy, find investments, have the research project approved, write, write, write and make scientific presentations at conferences to share your results with other scientists.
Mind the Graph is a tool to improve science communication. In addition to graphical abstracts and infographics, you can create all your slides for presentations in our platform. We are very proud when our users present their work in scientific congress using our platform. So today I’ll show you an example of a scientific presentation using Mind the Graph.
Rui Daniel Prediger is a PhD scientist and a Mind the Graph user. His research of neuroscience, pharmacology and neurodegenerative diseases has increased the scientific knowledge in his field.
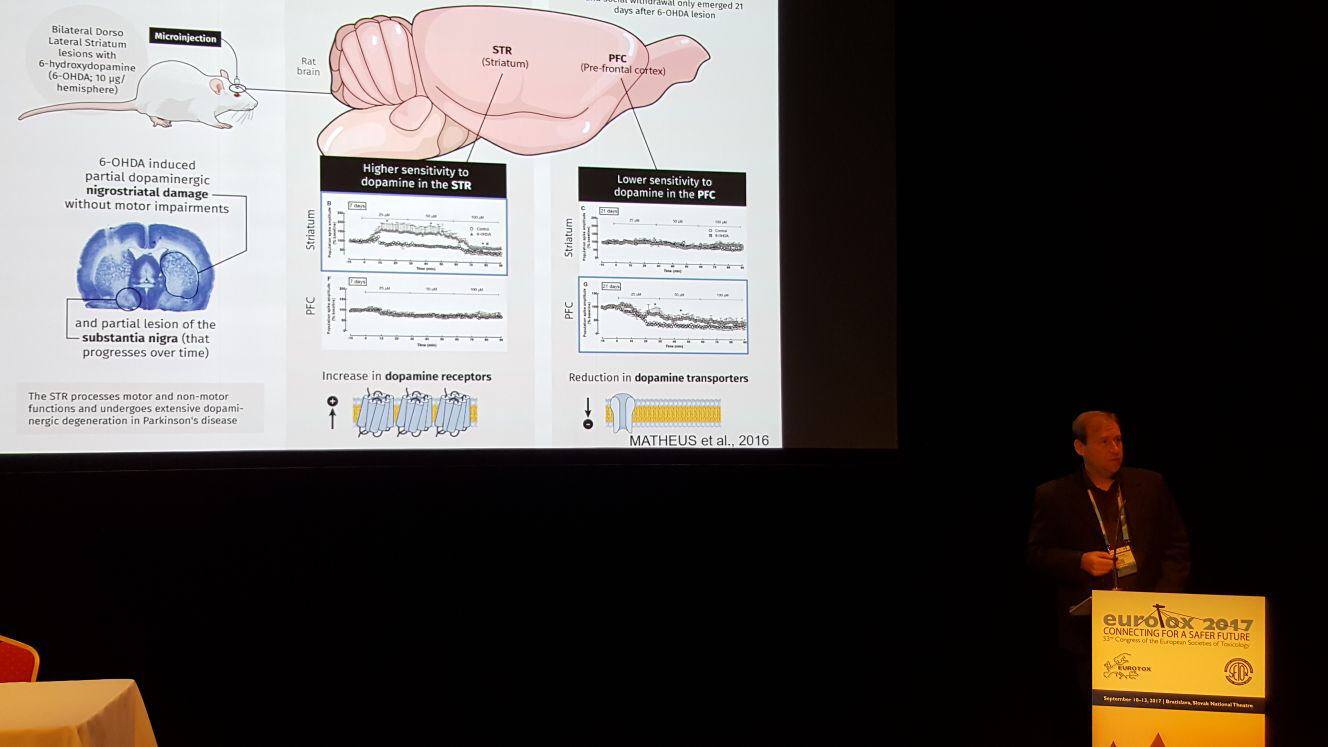
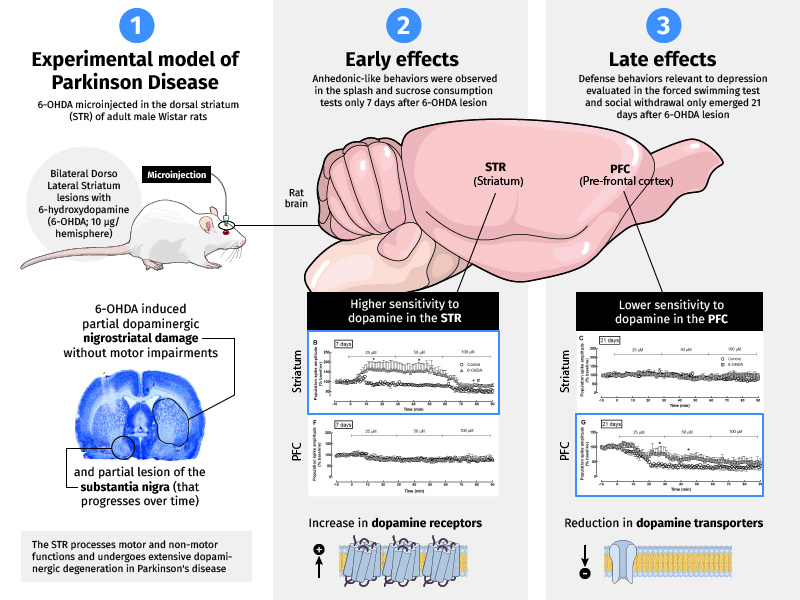
In one of his studies, he investigated the temporal dissociation between the role of the dorsolateral striatum (DLS) and the pre-frontal cortex in the appearance of anhedonia and defense behaviors relevant todepression in rats submitted to bilateral DLS lesions with 6-OHDA.
To present his results at scientific conferences, he uses slides created with Mind the Graph:
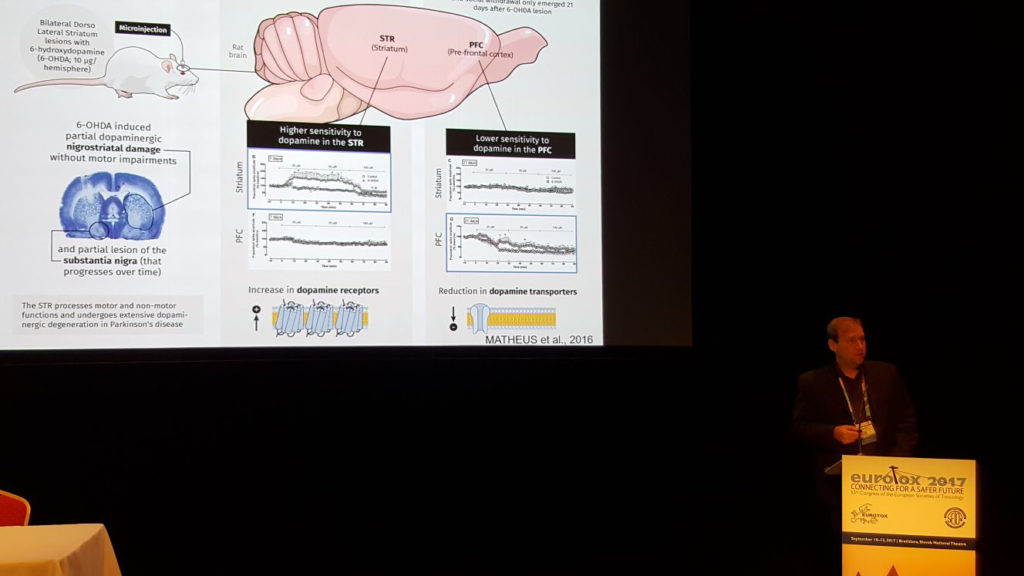
It is always better to display data using an organized and beautiful slide. The images are a powerful tool to help people understand your work in a clearly way. Below you can see the slides with mind the graph illustrations and the charts with the data. You can upload your own images to mind the graph and use them combined with the illustrations. Look how clear and beautiful is the final result:
Do you want to create beautiful scientific presentations for academic conferences too?
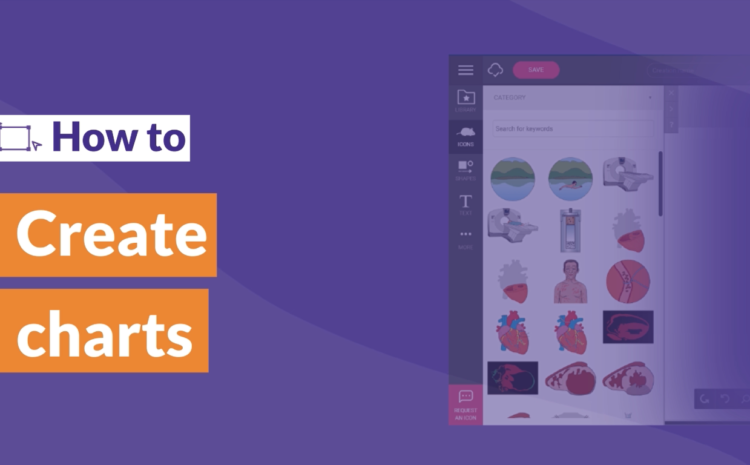
Create a presentation using Mind the Graph is really simple.
Besides the creation process, you can also present your work directly from our platform. Just go to your profile, choose a creation and click to present.
Create multiple slides is a feature available only to subscribers. If you aren’t a Mind the graph subscriber yet, you can start now with only 9USD.


Subscribe to our newsletter
Exclusive high quality content about effective visual
communication in science.