A scientist work life isn’t just “wearing a lab coat and doing research”. We also have to deal with burocracy, find investments, have the research project approved, write, write, write and make scientific presentations at conferences to share your results with other scientists.
Mind the Graph is a tool to improve science communication. In addition to graphical abstracts and infographics, you can create all your slides for presentations in our platform. We are very proud when our users present their work in scientific congress using our platform. So today I’ll show you an example of a scientific presentation using Mind the Graph.
Rui Daniel Prediger er forsker med doktorgrad og bruker av Mind the Graph. Hans forskning innen nevrovitenskap, farmakologi og nevrodegenerative sykdommer har bidratt til å øke den vitenskapelige kunnskapen på feltet.
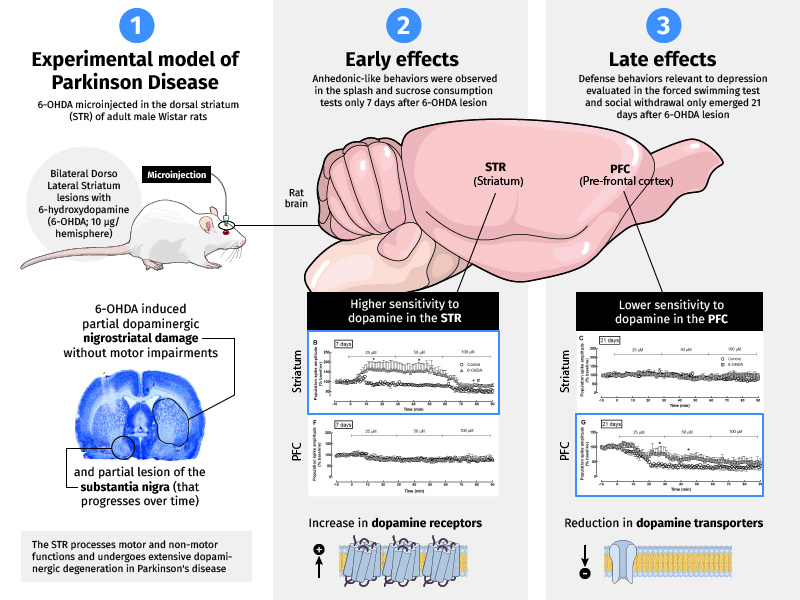
I en av sine studierI en studie av rotter som ble utsatt for bilaterale DLS-lesjoner med 6-OHDA, undersøkte han den tidsmessige dissosiasjonen mellom rollen til dorsolateralt striatum (DLS) og prefrontal cortex i forekomsten av anhedoni og forsvarsatferd som er relevant for depresjon.
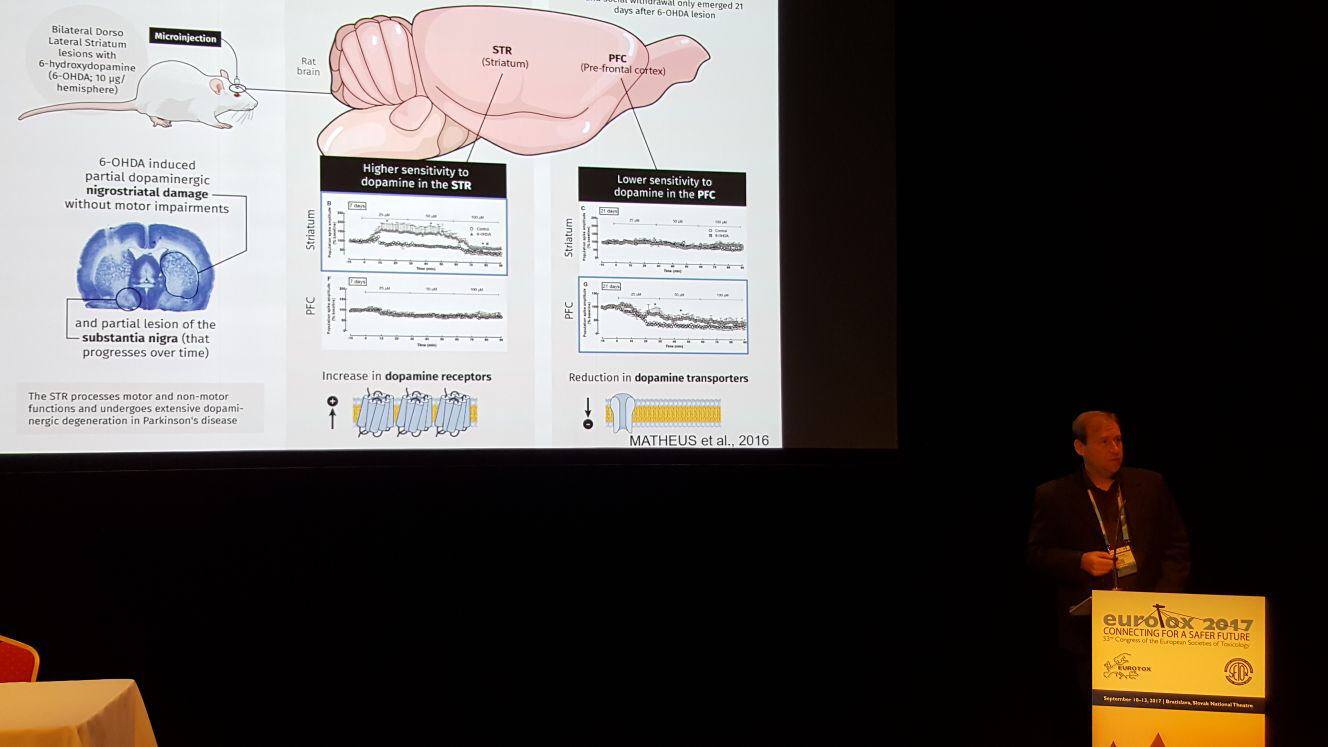
Når han presenterer resultatene sine på vitenskapelige konferanser, bruker han lysbilder laget med Mind the Graph:
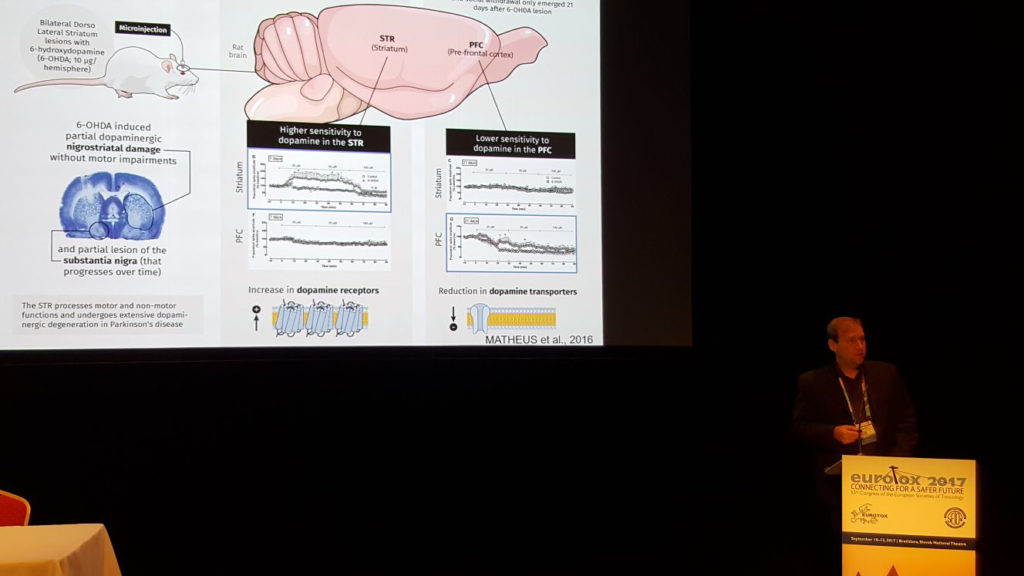
Det er alltid bedre å vise data ved hjelp av et organisert og vakkert lysbilde. Bildene er et effektivt verktøy for å hjelpe folk til å forstå arbeidet ditt på en tydelig måte. Nedenfor kan du se lysbildene med mind the graph-illustrasjoner og diagrammer med data. Du kan laste opp dine egne bilder til mind the graph og bruke dem sammen med illustrasjonene. Se hvor tydelig og vakkert sluttresultatet blir:
Vil du også lage flotte vitenskapelige presentasjoner til akademiske konferanser?
Det er veldig enkelt å lage en presentasjon med Mind the Graph.
I tillegg til opprettelsesprosessen kan du også presentere arbeidet ditt direkte fra plattformen vår. Bare gå til profilen din, velg en kreasjon og klikk for å presentere.
Opprett flere lysbilder er en funksjon som bare er tilgjengelig for abonnenter. Hvis du ikke abonnerer på Mind the graph ennå, kan du begynne nå for bare 9 USD.


Abonner på nyhetsbrevet vårt
Eksklusivt innhold av høy kvalitet om effektiv visuell
kommunikasjon innen vitenskap.