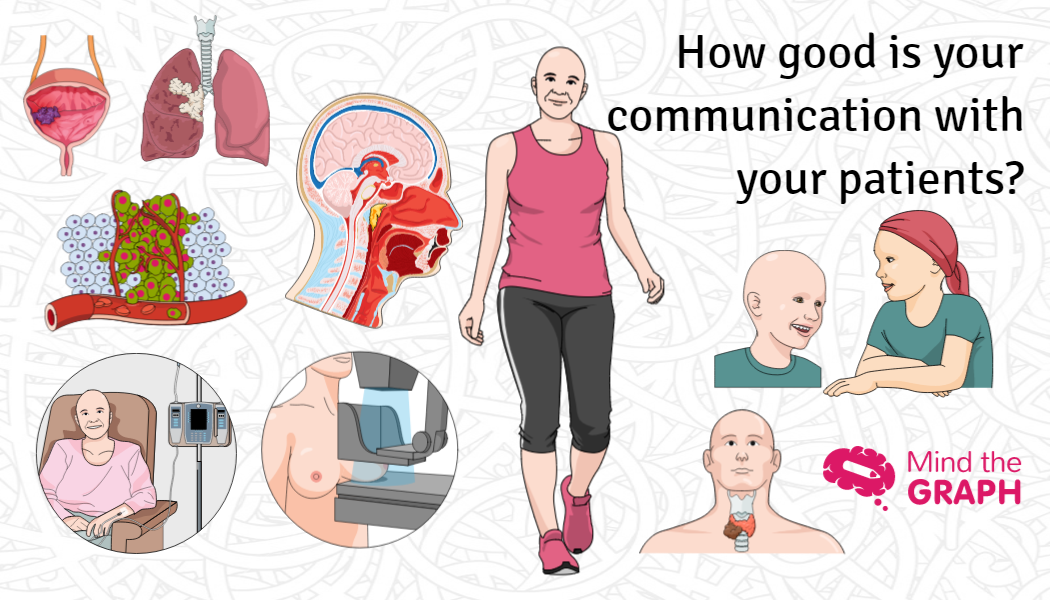
Mind the Graph Blog
  • Infographic maker
  • How it works
  • Tutorials
  • Portfolio
Mind the Graph Blog

Health and Covid19: 5 Tips to boost your immunity

Carol Uncategorized May 24, 2020
Create beautiful scientific infographics with no effort We turn scientists into designers to boost your impact. Globally. Try for freeRead more
wave

Oncology: Using medical illustrations to talk about a sensitive subject

Fabiola Soares Portfolio May 8, 2019
It isn’t easy to be a physician. Besides being constantly updated about new procedures and technology, you need to have great communication skills. If your patients understand well the procedure and trust you, the treatment is more likely to be successful.…Read more
wave

New scientific illustrations and infographics of gynecology and embryology

Fabiola Soares Infographic February 21, 2019
Scientific illustrations are a powerful tool to comunicate in science. As a visual specie, we learn much better when the visual information is attractive and didactic. Thinking of it, we are improving our library of scientific illustrations. We have thousands of…Read more
wave

World AIDS day: An infographic to explain HIV cell pathway

Fabiola Soares Trends November 30, 2018
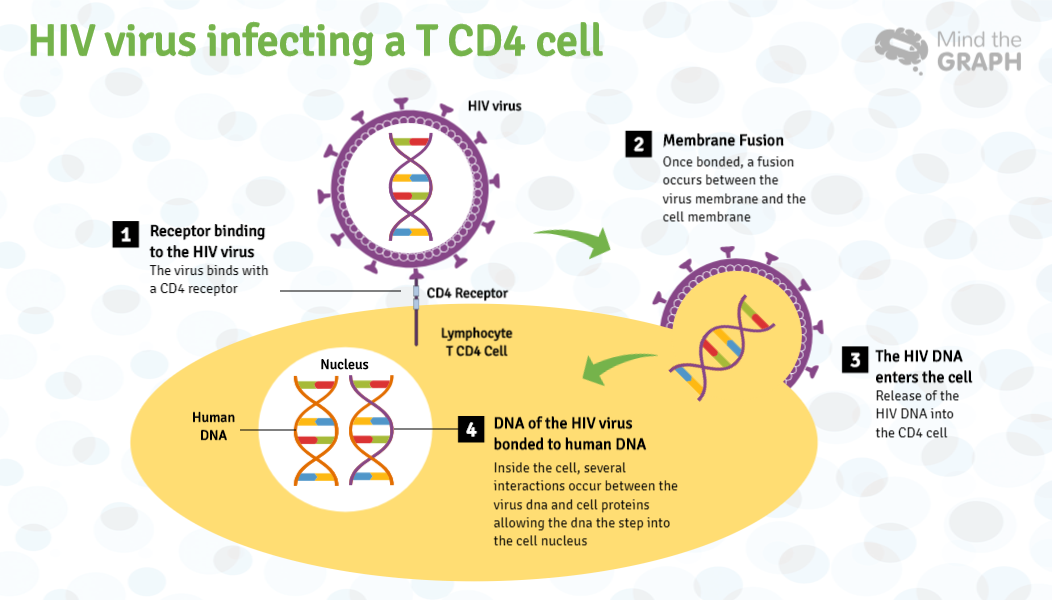
World AIDS Day, occurs every year on 1 December  since 1988. It is an international day to raising awareness of the AIDS caused by HIV infection and to remember those who have died of the disease. World AIDS Day is one of…Read more
wave

What is Mind the Graph? Free infographic maker for science

Fabricio Pamplona Tools October 20, 2015
You never saw a free infographic maker like this one. Mind the Graph has everything you need to create stunning presentations, banner, posters and graphical abstracts. It’s way better infographic maker than Canva or Piktochart, when it comes to scientific…Read more
wave

Create beautiful scientific
infographics with no effort

We turn scientists into designers to boost your impact. Globally.

Try for free
TRUSTED BY
© 2019, Gutentim. All Rights Reserved