#30 The best of life science illustrations
Hello again! As you may know, every week we add new illustrations to our library. […]
Hello again! As you may know, every week we add new illustrations to our library. […]
Olá! Sexta é dia de mostrar o melhor da nossa semana. Como você deve saber, […]
Visual resources are powerful to communicate better in science. Scientific illustrations are a good example […]
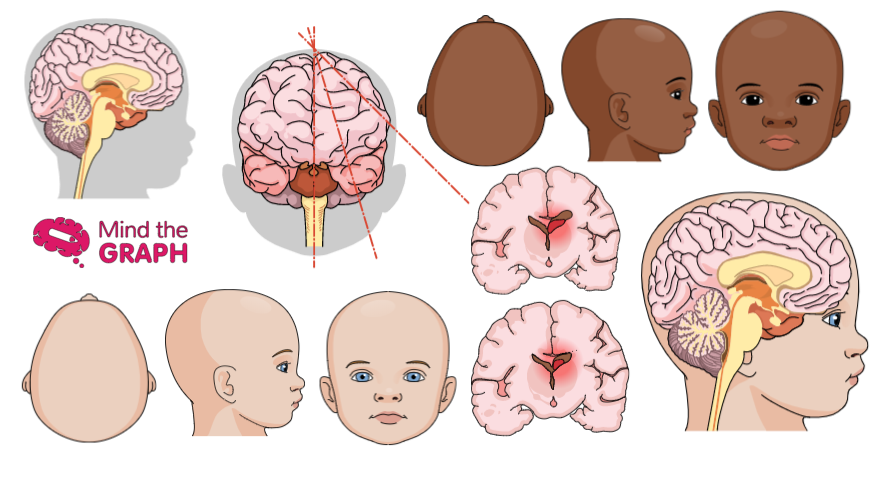
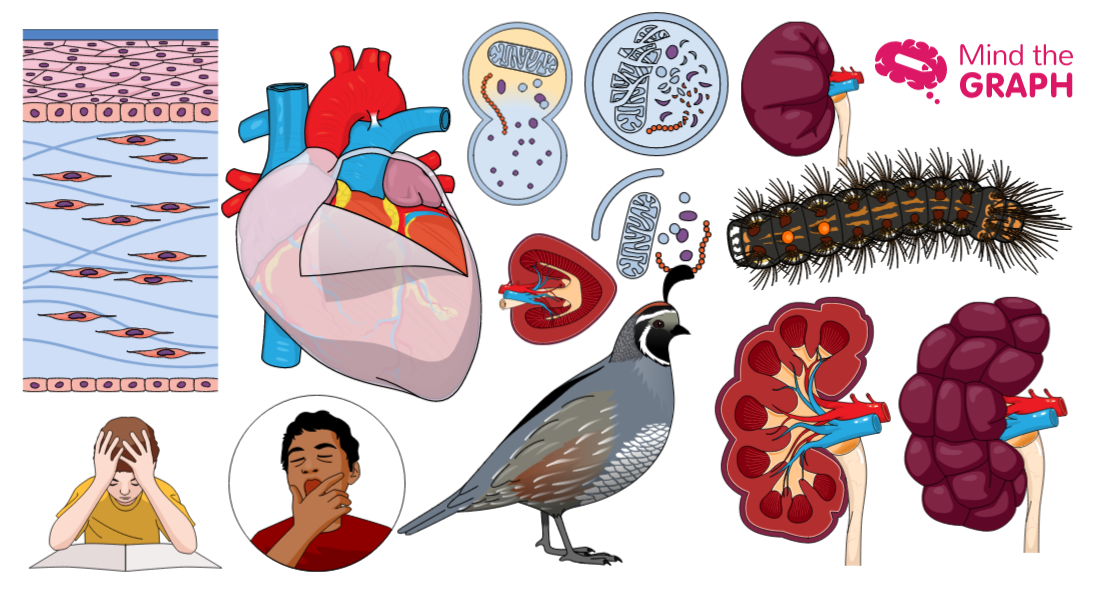
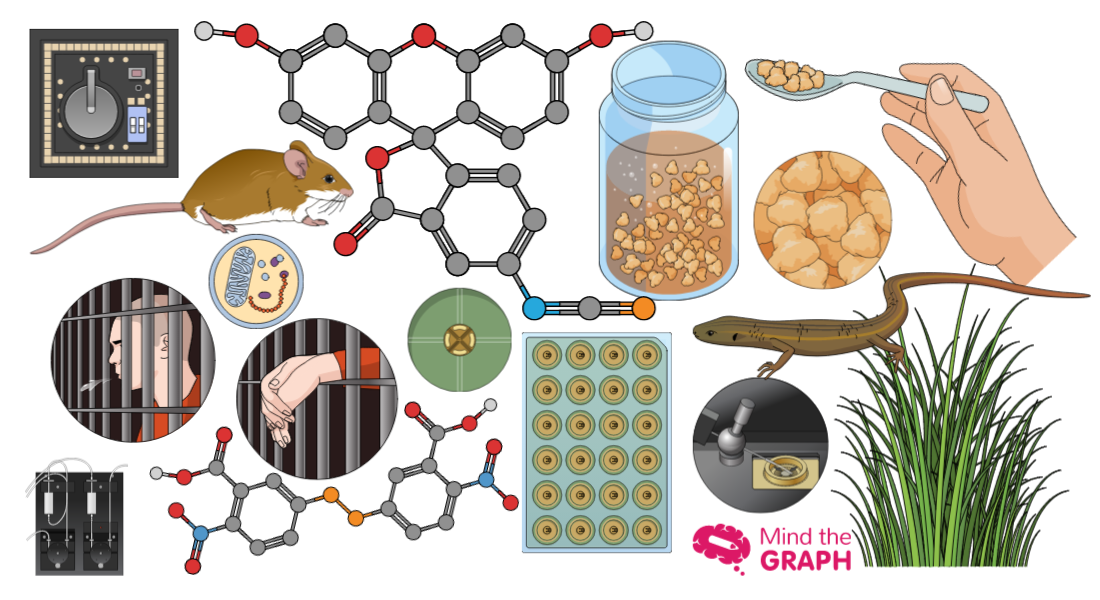
Friday is the day we show off our new scientific and medical illustrations that allows […]
Hello! Friday is a day to show the new scientific illustrations. This week we added several […]
To communicate the importance of science in our society, we need first be able to […]
Olá! É sexta-feira novamente (YAY). Você está correndo para o fim de semana? Ou você […]
It is time to show the new Mind the Graph scientific illustrations. As you know, […]
Nothing is so good that it can’t be better, am I right? The last weeks […]
Hello! As you know, we add new scientific illustrations every week in Mind the Graph. […]
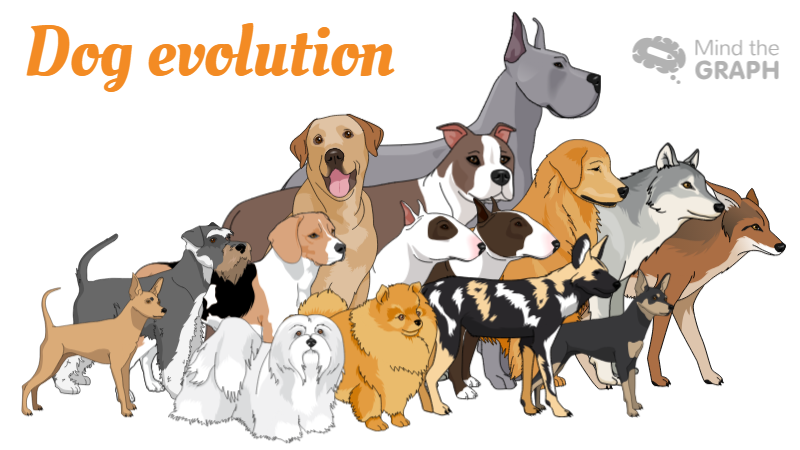
Dogs are people’s best friends and they evolved close to us when wolves and humans were […]
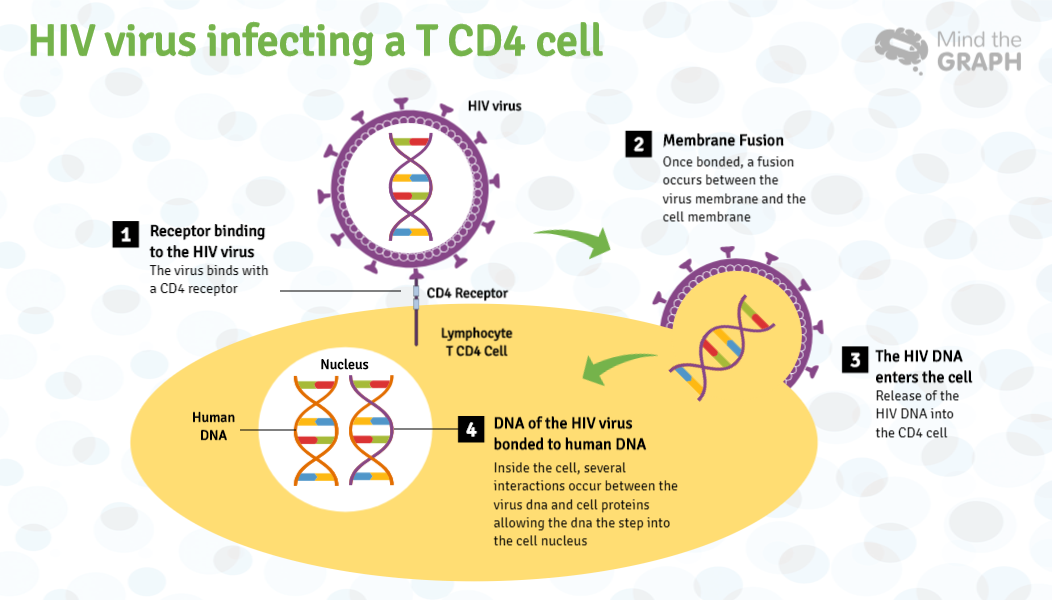
World AIDS Day, occurs every year on 1 December since 1988. It is an international day to […]
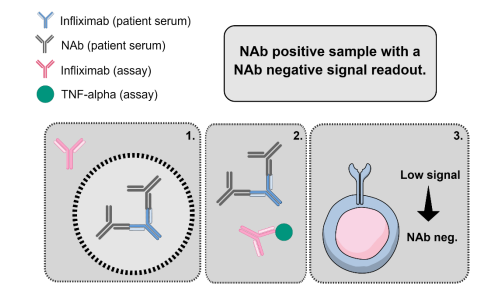
We always love to show off our users amazing work. Empower scientists to enable a […]