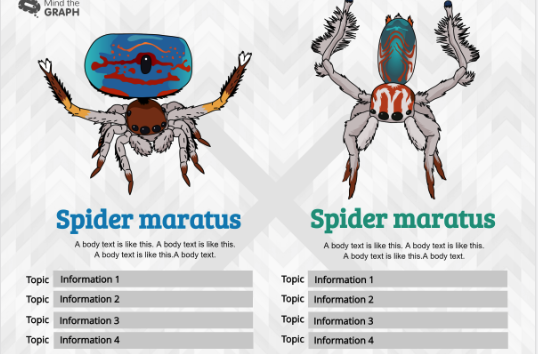
World AIDS Day, occurs every year on 1 December since 1988. It is an international day to raising awareness of the AIDS caused by HIV infection and to remember those who have died of the disease. World AIDS Day is one of…Read more
We always love to show off our users amazing work. Empower scientists to enable a more more visual and reachable science. In the post, I will present Christina Hermanrud research thesis for her doctoral degree entitled Immunogenicity of Biopharmaceuticals in Chronic Inflammatory diseases.…Read more
Sometimes, I receive e-mails from scientists, engineers, teachers and other professionals saying: Oh, I love Mind the Graph, but is only for life scientists. Indeed, this is a common mistake. Initially, we focused on biological and medical illustrations, but we…Read more
During the final materials stage of your paper, most Cell Press journals will ask for a Graphical Abstract. This can be a barrier if you are a scientist, not a designer. It is not easy to find beautiful and scientifically…Read more
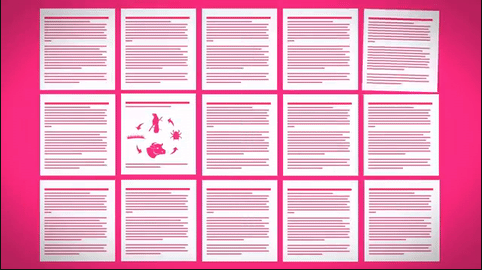
Creating a graphical abstract, infographic or presentation that is visually attractive and scientifically accurate isn’t an easy task. We have a library with thousands of scientific illustrations, mostly of life science to help scientists improve their communication. However, a beautiful illustration…Read more
It is always good to communicate new features in Mind the Graph. Our team is working to improve our platform to make it more practical and enjoyable. Today, I will talk about alignment and smart guides. If you want to…Read more
This is the fifth post in the series How to make an infographic. If you missed the last post, you can read it here. As I said in the last post, a picture is worth a thousand words. The illustrations…Read more
This is the fourth post in the series How to make an infographic. If you missed the last post, you can read it here. Now we already know the importance of sketching. The first version is always different from the final…Read more
How to make an infographic series This is the second post of the series How to make an infographic. If you missed the first post, you can read it here. Now you know the importance of visual assets in scientific…Read more
This was a great surprise for us. The blog FCiencias from Portugal, posted a video showing how they created an infographic with the Mind the Graph free infographic maker. They are from the area of health and used some data…Read more