4 min read
11/27/2019
Mind The Graph Scientific Blog is meant to help scientists learn how to communicate science in an uncomplicated way.
Today we have a guest author – Maryam Kamal – who is a font duos designer and will help us understand the right use of fonts in an infographic. She suggests that fonts should be used as duos. See her text below, and we hope you enjoy! “You sit down on your computer to start creating an […]
Olá! Espero que esteja aproveitando sua sexta-feira! Estou escrevendo para trazer boas notícias: temos muitas […]
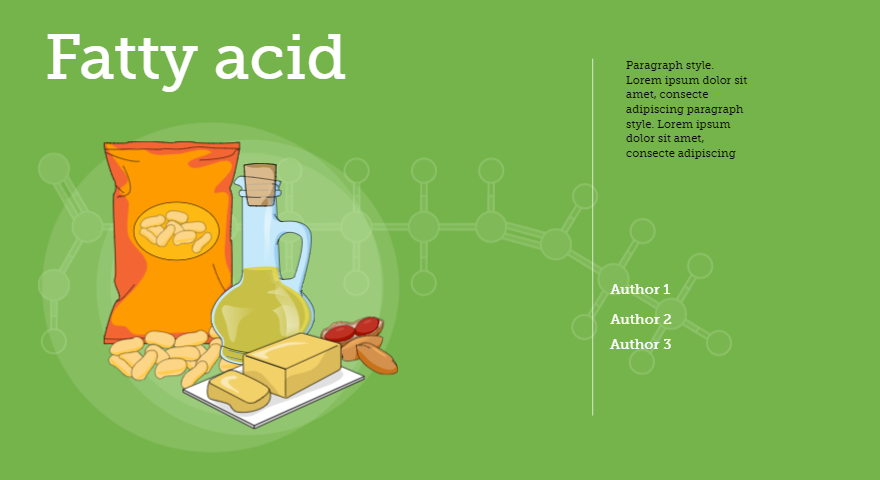
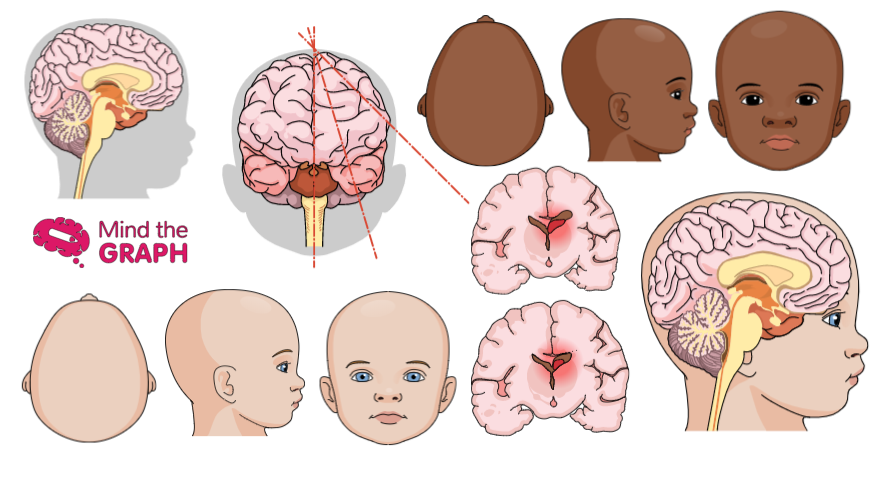
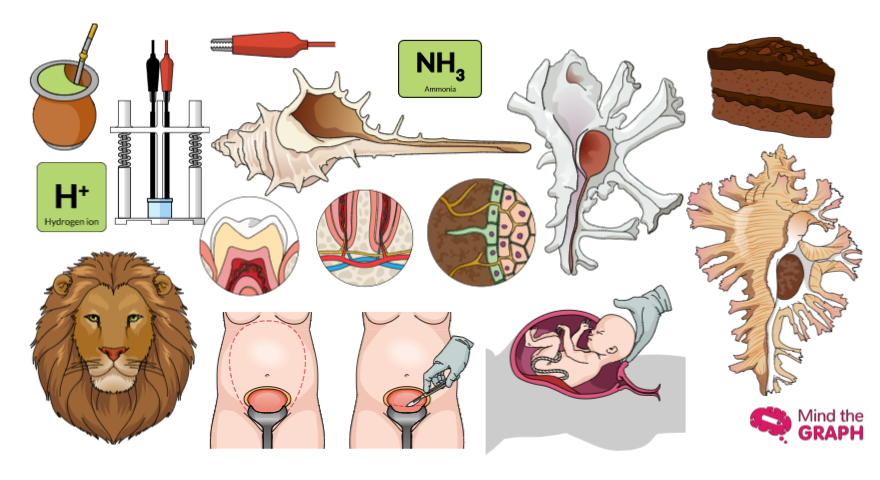
Hello again! As you may know, every week we add new illustrations to our library. […]
Discover how to create an effective graphical abstract. This guide helps you craft a compelling visual summary to enhance research impact.
Hello there! Are you excited for the weekend? We are too! Also, friday is the […]
Hi there, today I bring good news! As you may know, we provide infographics and […]
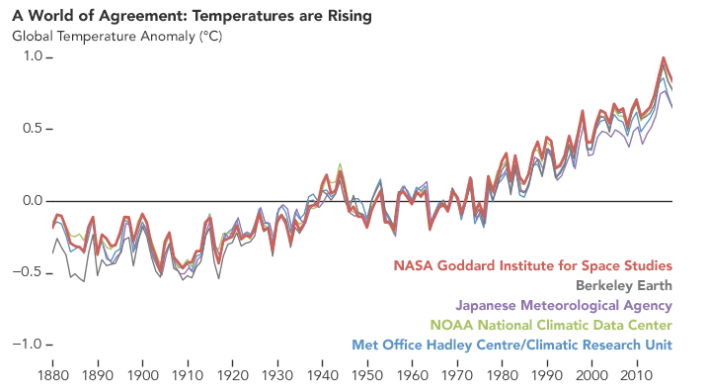
Climate change is still a controversial subject. Sometimes scientific evidences fade out faced personal opinions and […]
Olá! É sexta-feira novamente. Antes de falarmos sobre as expectativas para o fim de semana, […]
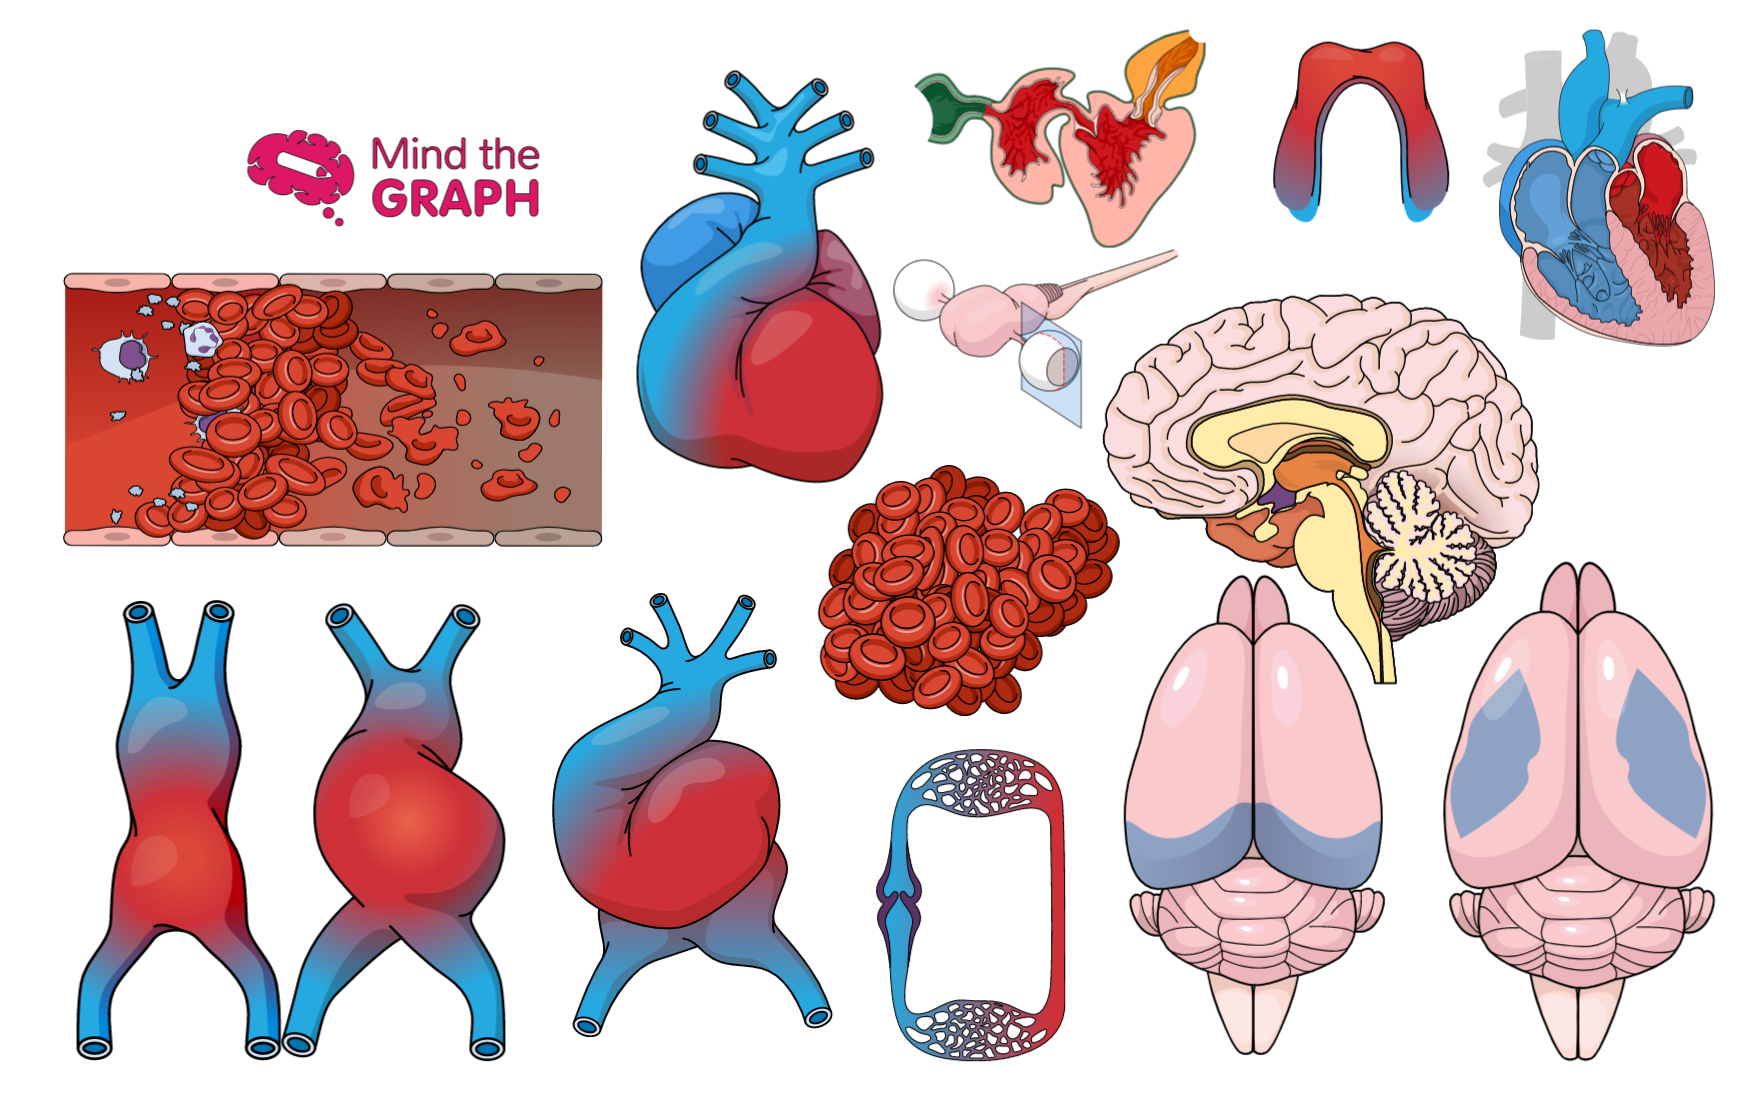
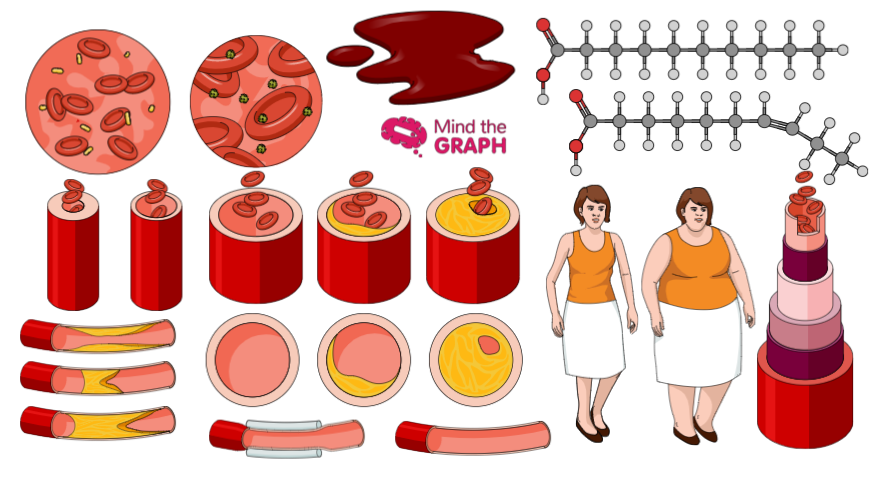
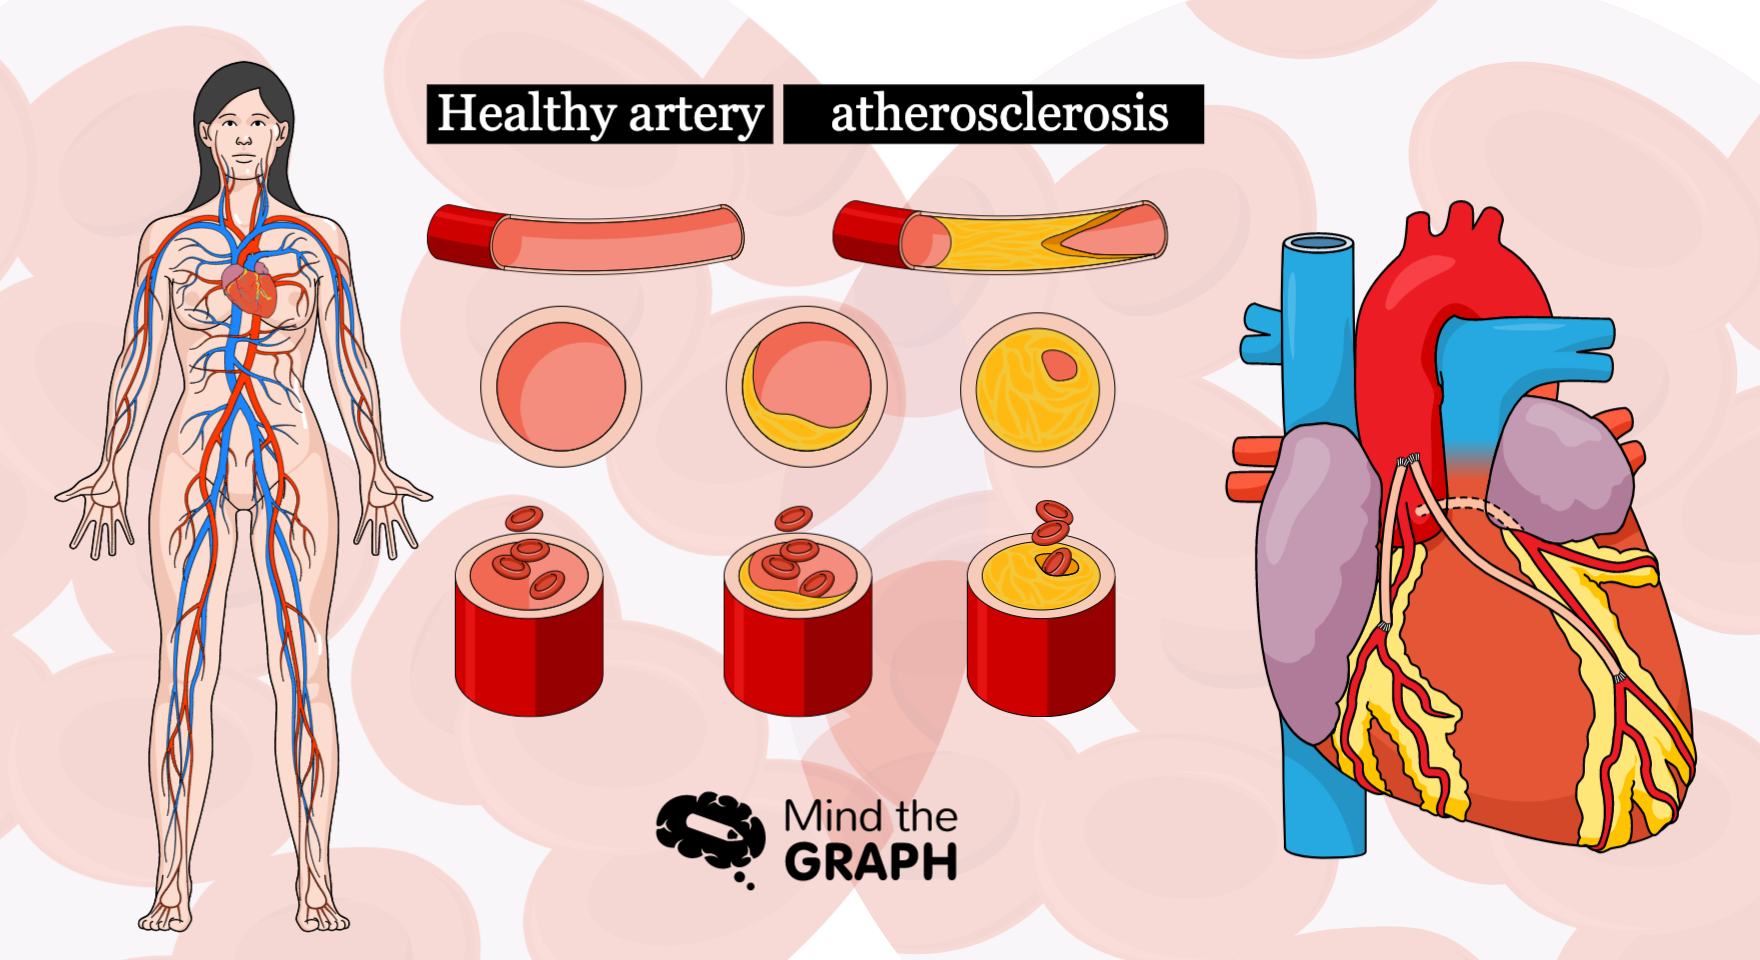
Atherosclerosis is a medical condition of the circulatory system. It happens when plaque accumulate inside […]
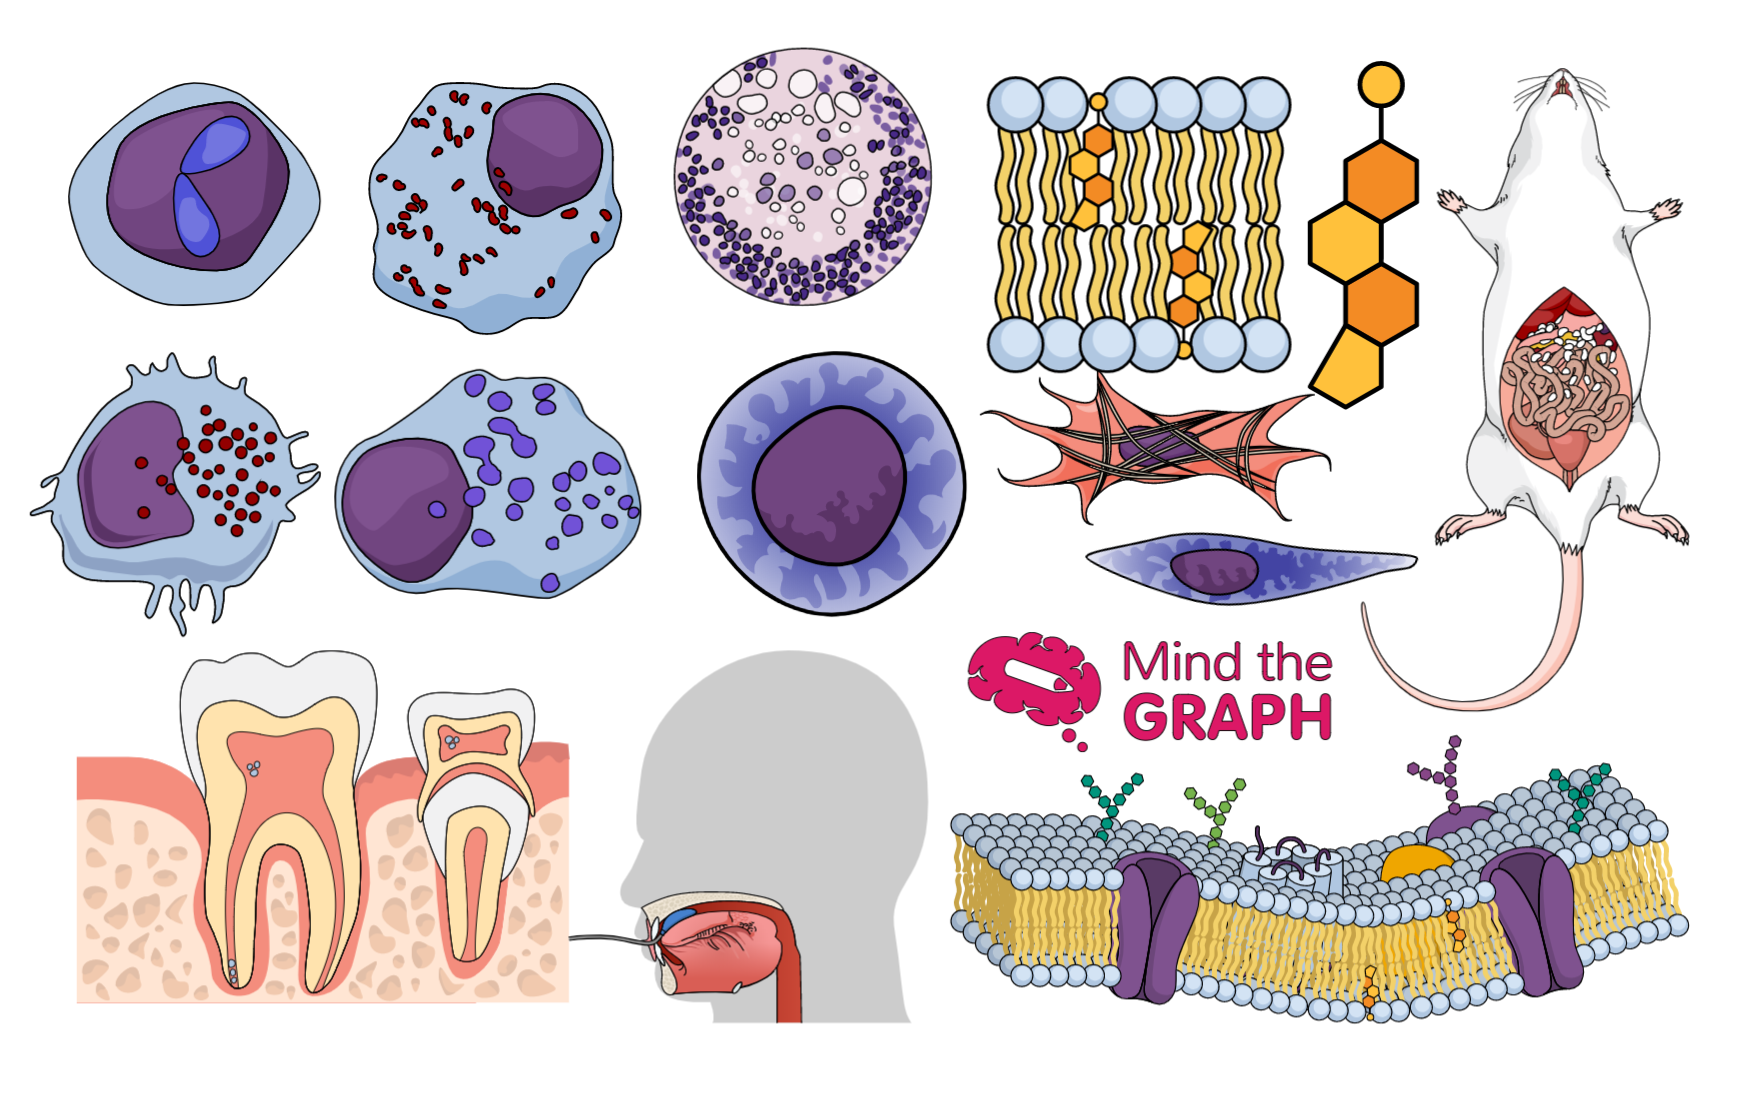
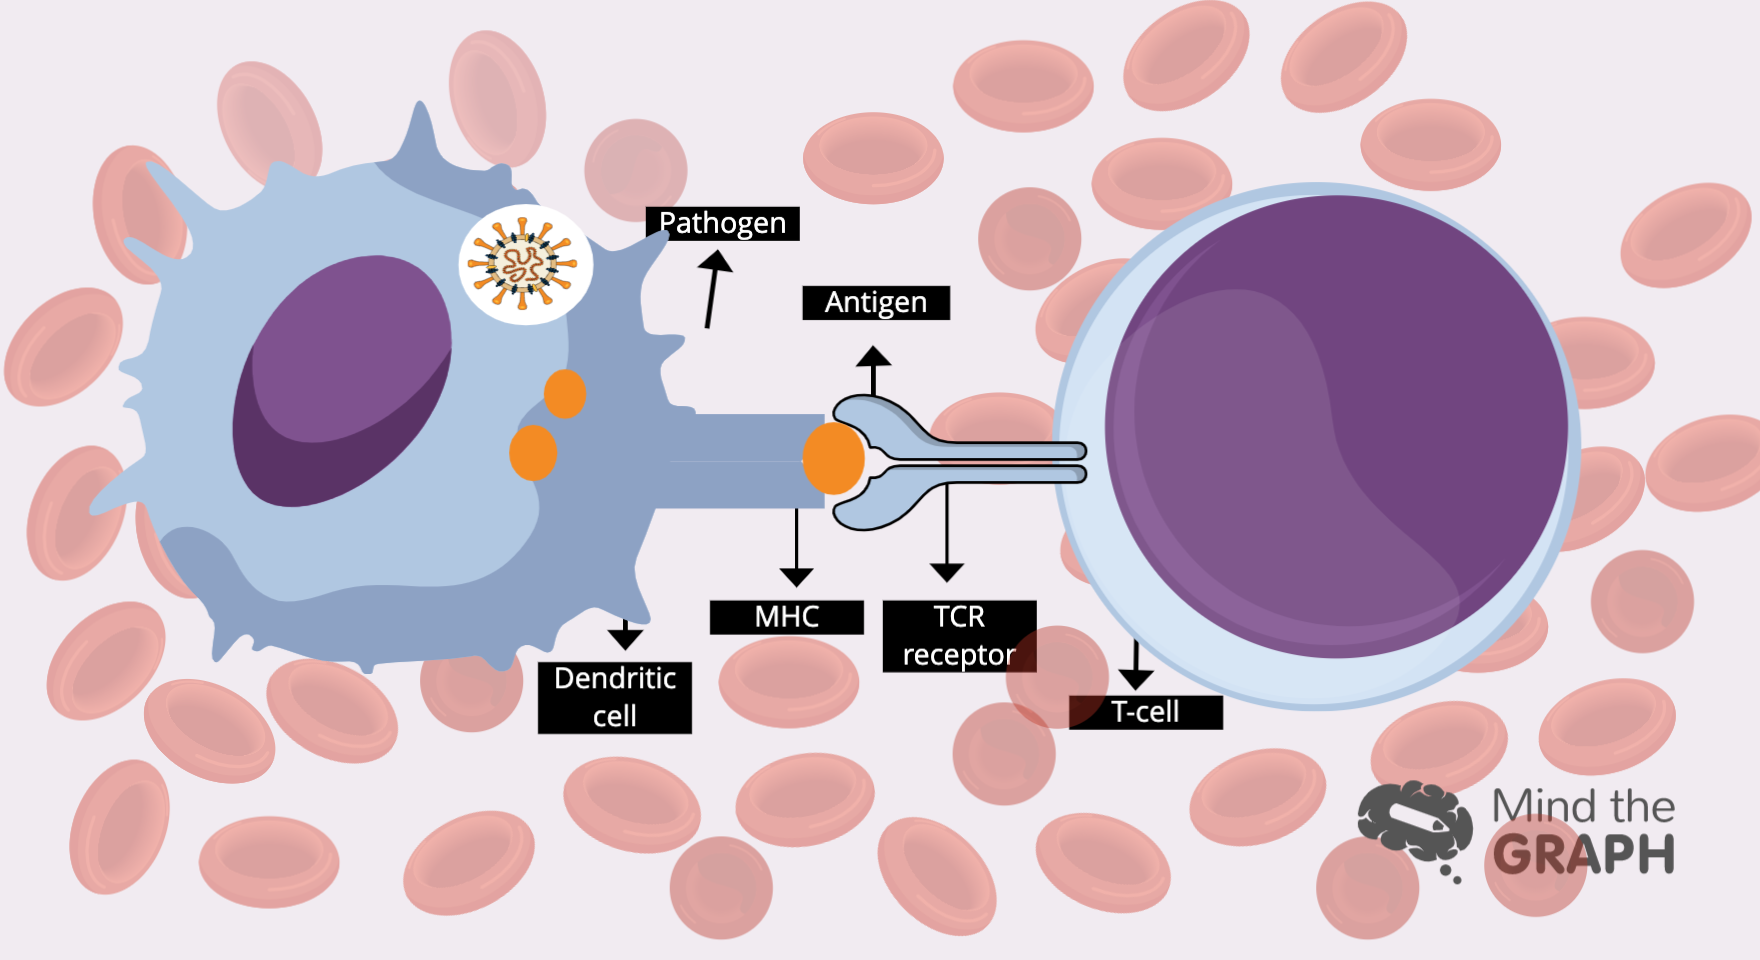
Os glóbulos brancos são responsáveis por defender nosso corpo contra ameaças, mantendo-nos vivos. Mas como […]
Olá! Sexta é dia de mostrar o melhor da nossa semana. Como você deve saber, […]
Yes. The global warming is real. At least according science. This is the short answer. […]
Hello there. Are you ready to see the best scientific illustrations of the week? As […]