Hi there, today I bring good news! As you may know, we provide infographics and graphical abstracts templates, so you don’t need to start from a blank canvas. Starting a creation using a template saves a lot of time, right? Also it helps when you don’t have inspiration to create a new design. So besides infographics templates, now you can find presentation slides on our gallery. Now is way easier to combine colors, illustrations and different elements in a presentation.
As a doctor, a scientist or a business person, you may know that presentations are part of the job. Like it or not, communicate well is essential to be sucessful.
Your data deserves to be presented in a professional and attractive way
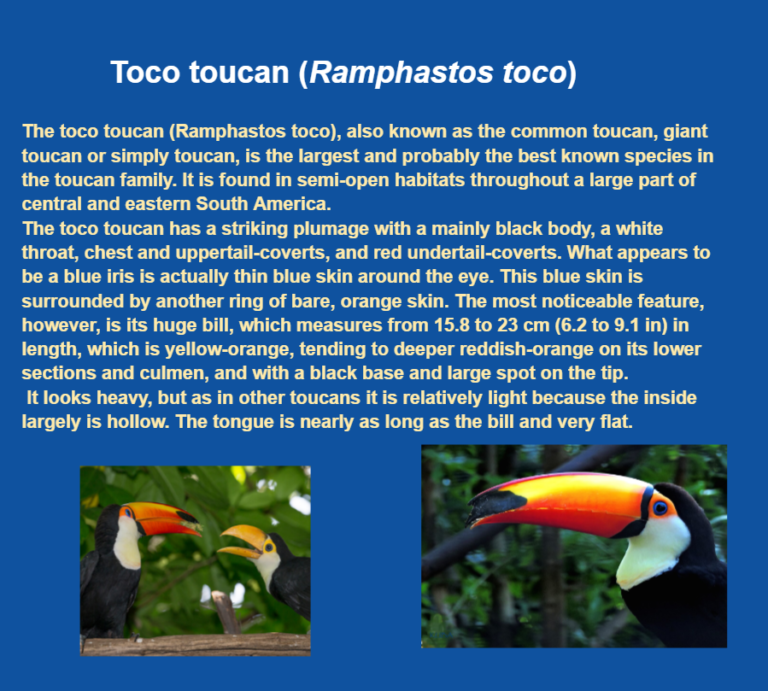
Stop doing this:
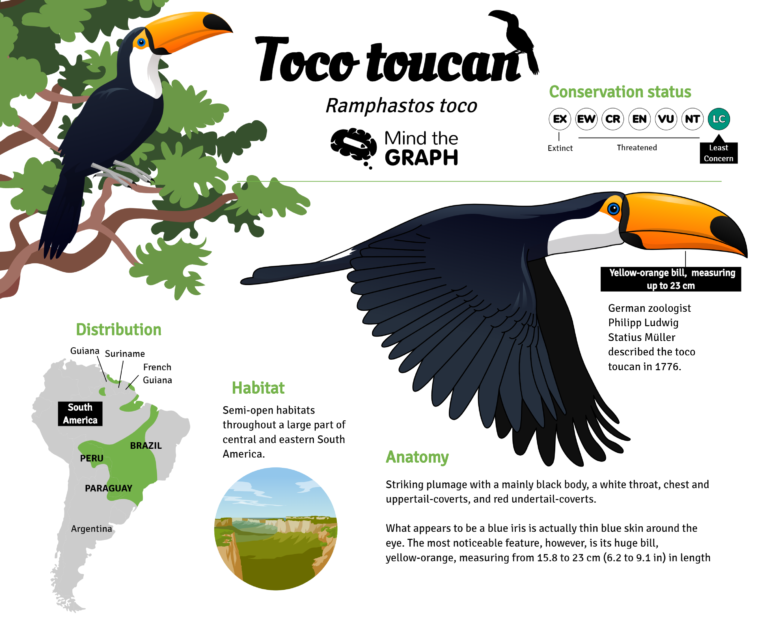
And start doing this:
I already wrote a tutorial to help you create scientific presentations. So check the tutorial, choose the template you like the most and go ahead to show your results to the world!
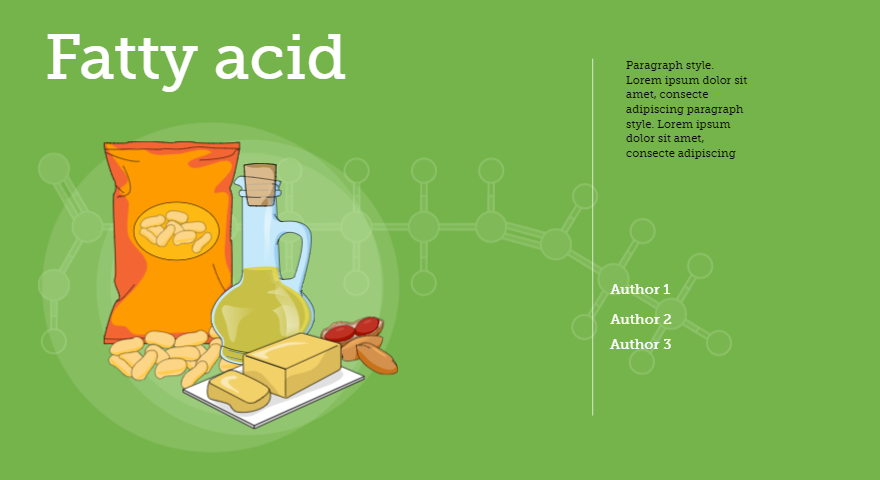
You can check all the templates on Mind the Graph, but let me give you some spoiler:

And other option:

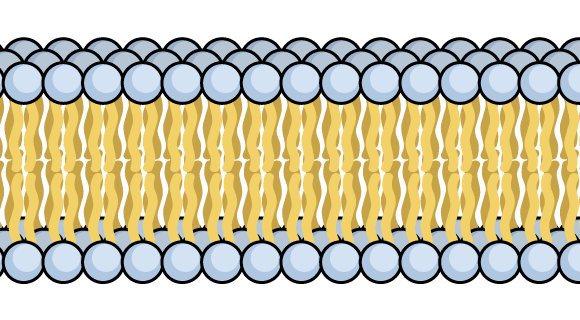
All these illustrations used in the presentations are available on Mind the Graph. Also, the are just inspirations. If you want to, you can change the illustrations for others from your field. Are you read to start?

Subscribe to our newsletter
Exclusive high quality content about effective visual
communication in science.

