5 min read
06/08/2021
Mind The Graph Scientific Blog is meant to help scientists learn how to communicate science in an uncomplicated way.
A great part of the scientist’s routine is to design and perform experiments. The combination of laboratory techniques will answer most of the questions proposed by scientists, and the workflow to suggest new methods depends on the scientist’s background and experience. For biologists, cell images can say a lot about what’s going on with the […]
Over a period of one year, the world has changed forever. COVID pandemic is giving […]
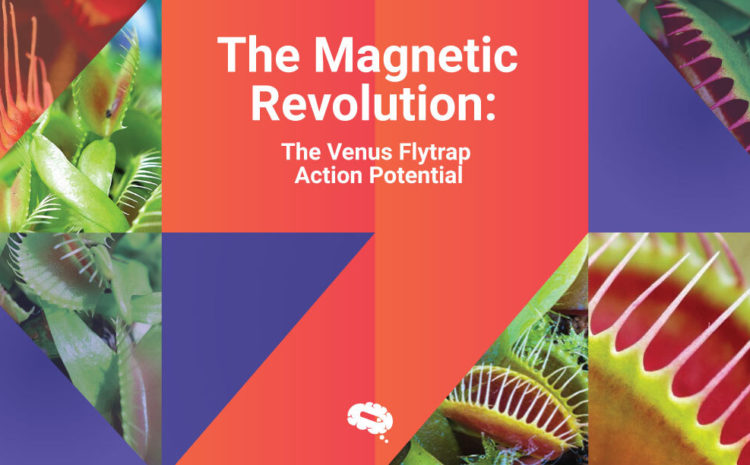
Dionaea muscipula popularly known as Venus Flytrap is a carnivorous plant that traps its prey […]
Welcome to the Mind the Graph Experience! This is the first article of a series […]
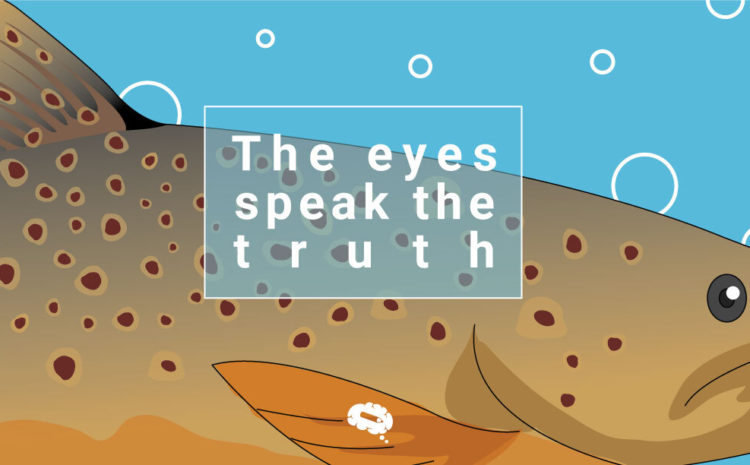
That’s right, all the answers lie in the eyes. Even when it comes to the […]
Whether you are a professor responsible for a research laboratory or a scientist part of […]
As researchers, we all get used to a traditional structure of scientific publications and scientific […]
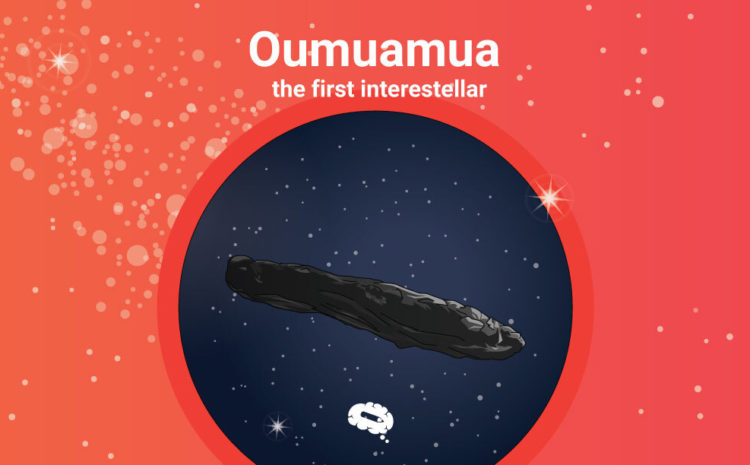
A little more than three years ago a strange object in the sky 2017 appeared. […]
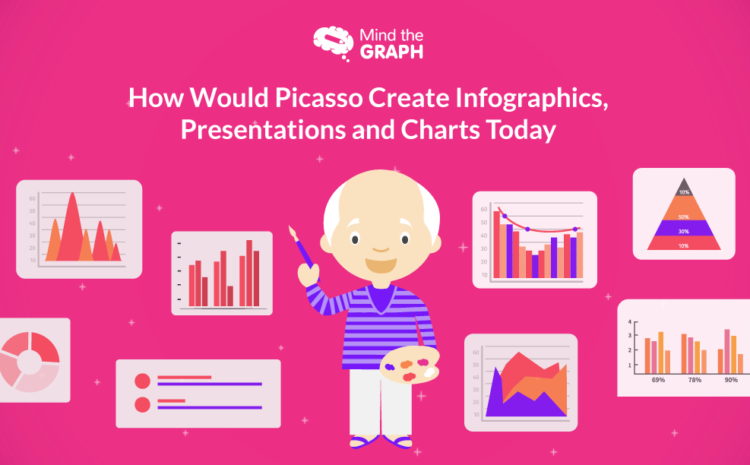
Ever heard of Guernica? The Weeping Woman? Or the Girl With Mandolin? These are some […]
Do you want to know how to make your research papers stand out through charts and graphs? Then this blog is what you need. Read it now!
Canva is surely one of the best graphic design tools we have on the web. […]
Visuals such as Infographics and presentations are a great content marketing tool. However, they might […]
In the past decade many clinical trial studies reported positive and promising results in the […]