Ever heard of Guernica? The Weeping Woman? Or the Girl With Mandolin?
These are some of the most famous works by the maestro Pablo Picasso himself, at least as per the internet!
However, when one has produced over 1500 artistic creations spanning his lifetime, it is a little difficult to choose just a top few.
Apart from being the most well-known and influential painter of all time, Picasso is also credited with the invention and discovery of a lot of new styles of painting as well as art forms, like sculpture and collage while simultaneously having his own phases of art like the Blue Period, The Cubism Period, and so on.
And after all his accomplishments, here we wonder – what would he have thought about the infographics and their creation process as we have today?
Making Infographics Is An Art
We, at Mind the Graph, strongly believe that designing a beautiful piece of graph is no less than painting an empty canvas to express what you can’t verbally.
Both run parallel in the way where accurate representation of a sentiment, fact, or trend might not be as easily possible or comprehensible than colors on a sheet of paper, spilled in a way that they acutely present the message their maker wishes to broadcast to its viewers.
Nevertheless, in the past few years, we’ve come across a large number of charts attempting to exhibit information but failing miserably at it because of small mistakes committed from its creator’s end.
Therefore, hereon we attempt to tackle each of these errors and while we’re at it, give you some basic tips to turn your infographic into a masterpiece, quite like the maestro himself.
Why Are Infographics Important In The First Place?
Graphs have been used for decades now owing to their ability in getting the message across, effectively and efficiently. For a quick recap though, we have listed a few reasons below.
To communicate a message in a compact way
It is very important to communicate clear messages in the most effective and attractive way possible, just like Picasso used to. His paintings touched the audiences in their heart’s innermost crevices and your chart needs to reach your viewer’s deepest consciousness. That is a great way to ensure an information’s recall value. The numbers suggest that up to 65% of data can be remembered by a reader if shared through an image along with the text.
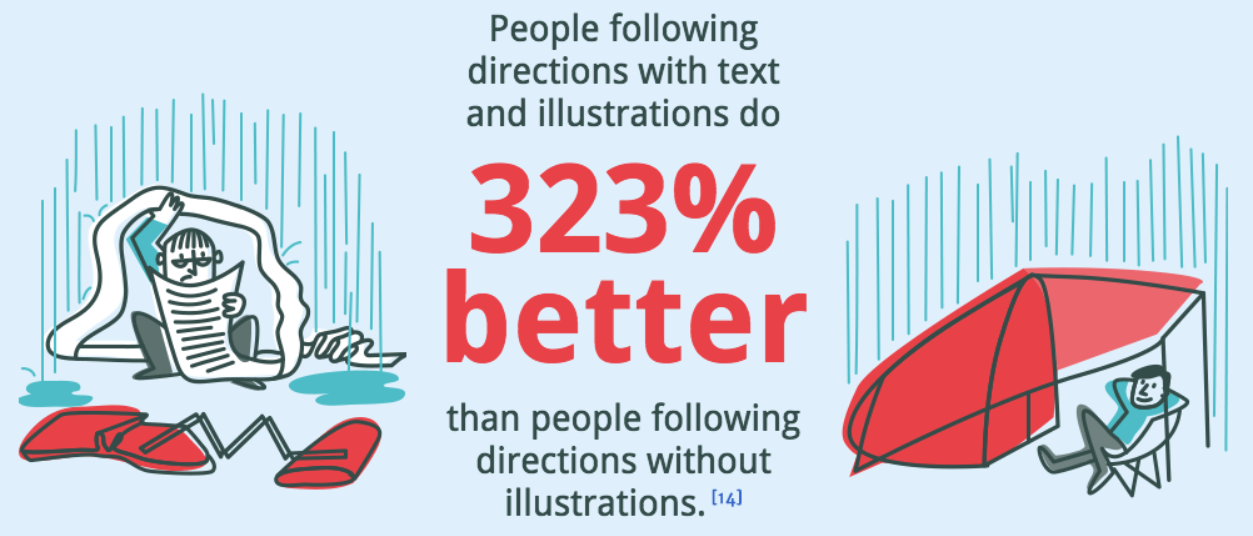
Increased comprehension for the layman
Not everyone is a whiz at statistics and mathematics – I know I’m not – and you need to keep that in mind while publishing your reports. It could be a topic as simple as how you spent your entire day or a complex one like the division of sources of income in an economy, your results would only be of use when they can be comprehended by all interested parties. The use of a graph is an amazing solution to that!
Easier to analyze data and discern cause-effect relationships
The readers of your infographic are not always looking for exact figures but sometimes just for a cause behind the fluctuations in a certain element or factor. This analysis is simpler to go through with when one is dealing with line charts or bar graphs as opposed to tabulated data with a bunch of statistical formulae applied to it.
Quicker discovery of patterns
Realizing the presence of an existing or upcoming pattern or trend is incredibly useful, especially when dealing with time-sensitive data. Be it the predictions for the share market, climate change, or even something as significant as matters of national security, charts prove useful in providing information at a glance.
Visually appealing which draws a reader’s attention
A layman browsing through a case study or a survey report may not be as interested in reading the entire 40-page report you’ve published as he/ she would be in knowing the end result and maybe the causative factors. The best plan of action in such cases is to create infographics that can give him/ her the exact information they’re looking for without having to go through long pages of technical terms and statistical data. 49% of marketers, as per a survey by Venngage, emphasize the use of visual content for their blogs.
Why Did We Choose Picasso For This Topic?
Picasso is indisputably one of the greatest masters of his art, and as we discussed above, to make infographics is no less an art form.
But if you’re wondering out of all artists why we chose to go with him – well, read along to find your answers.
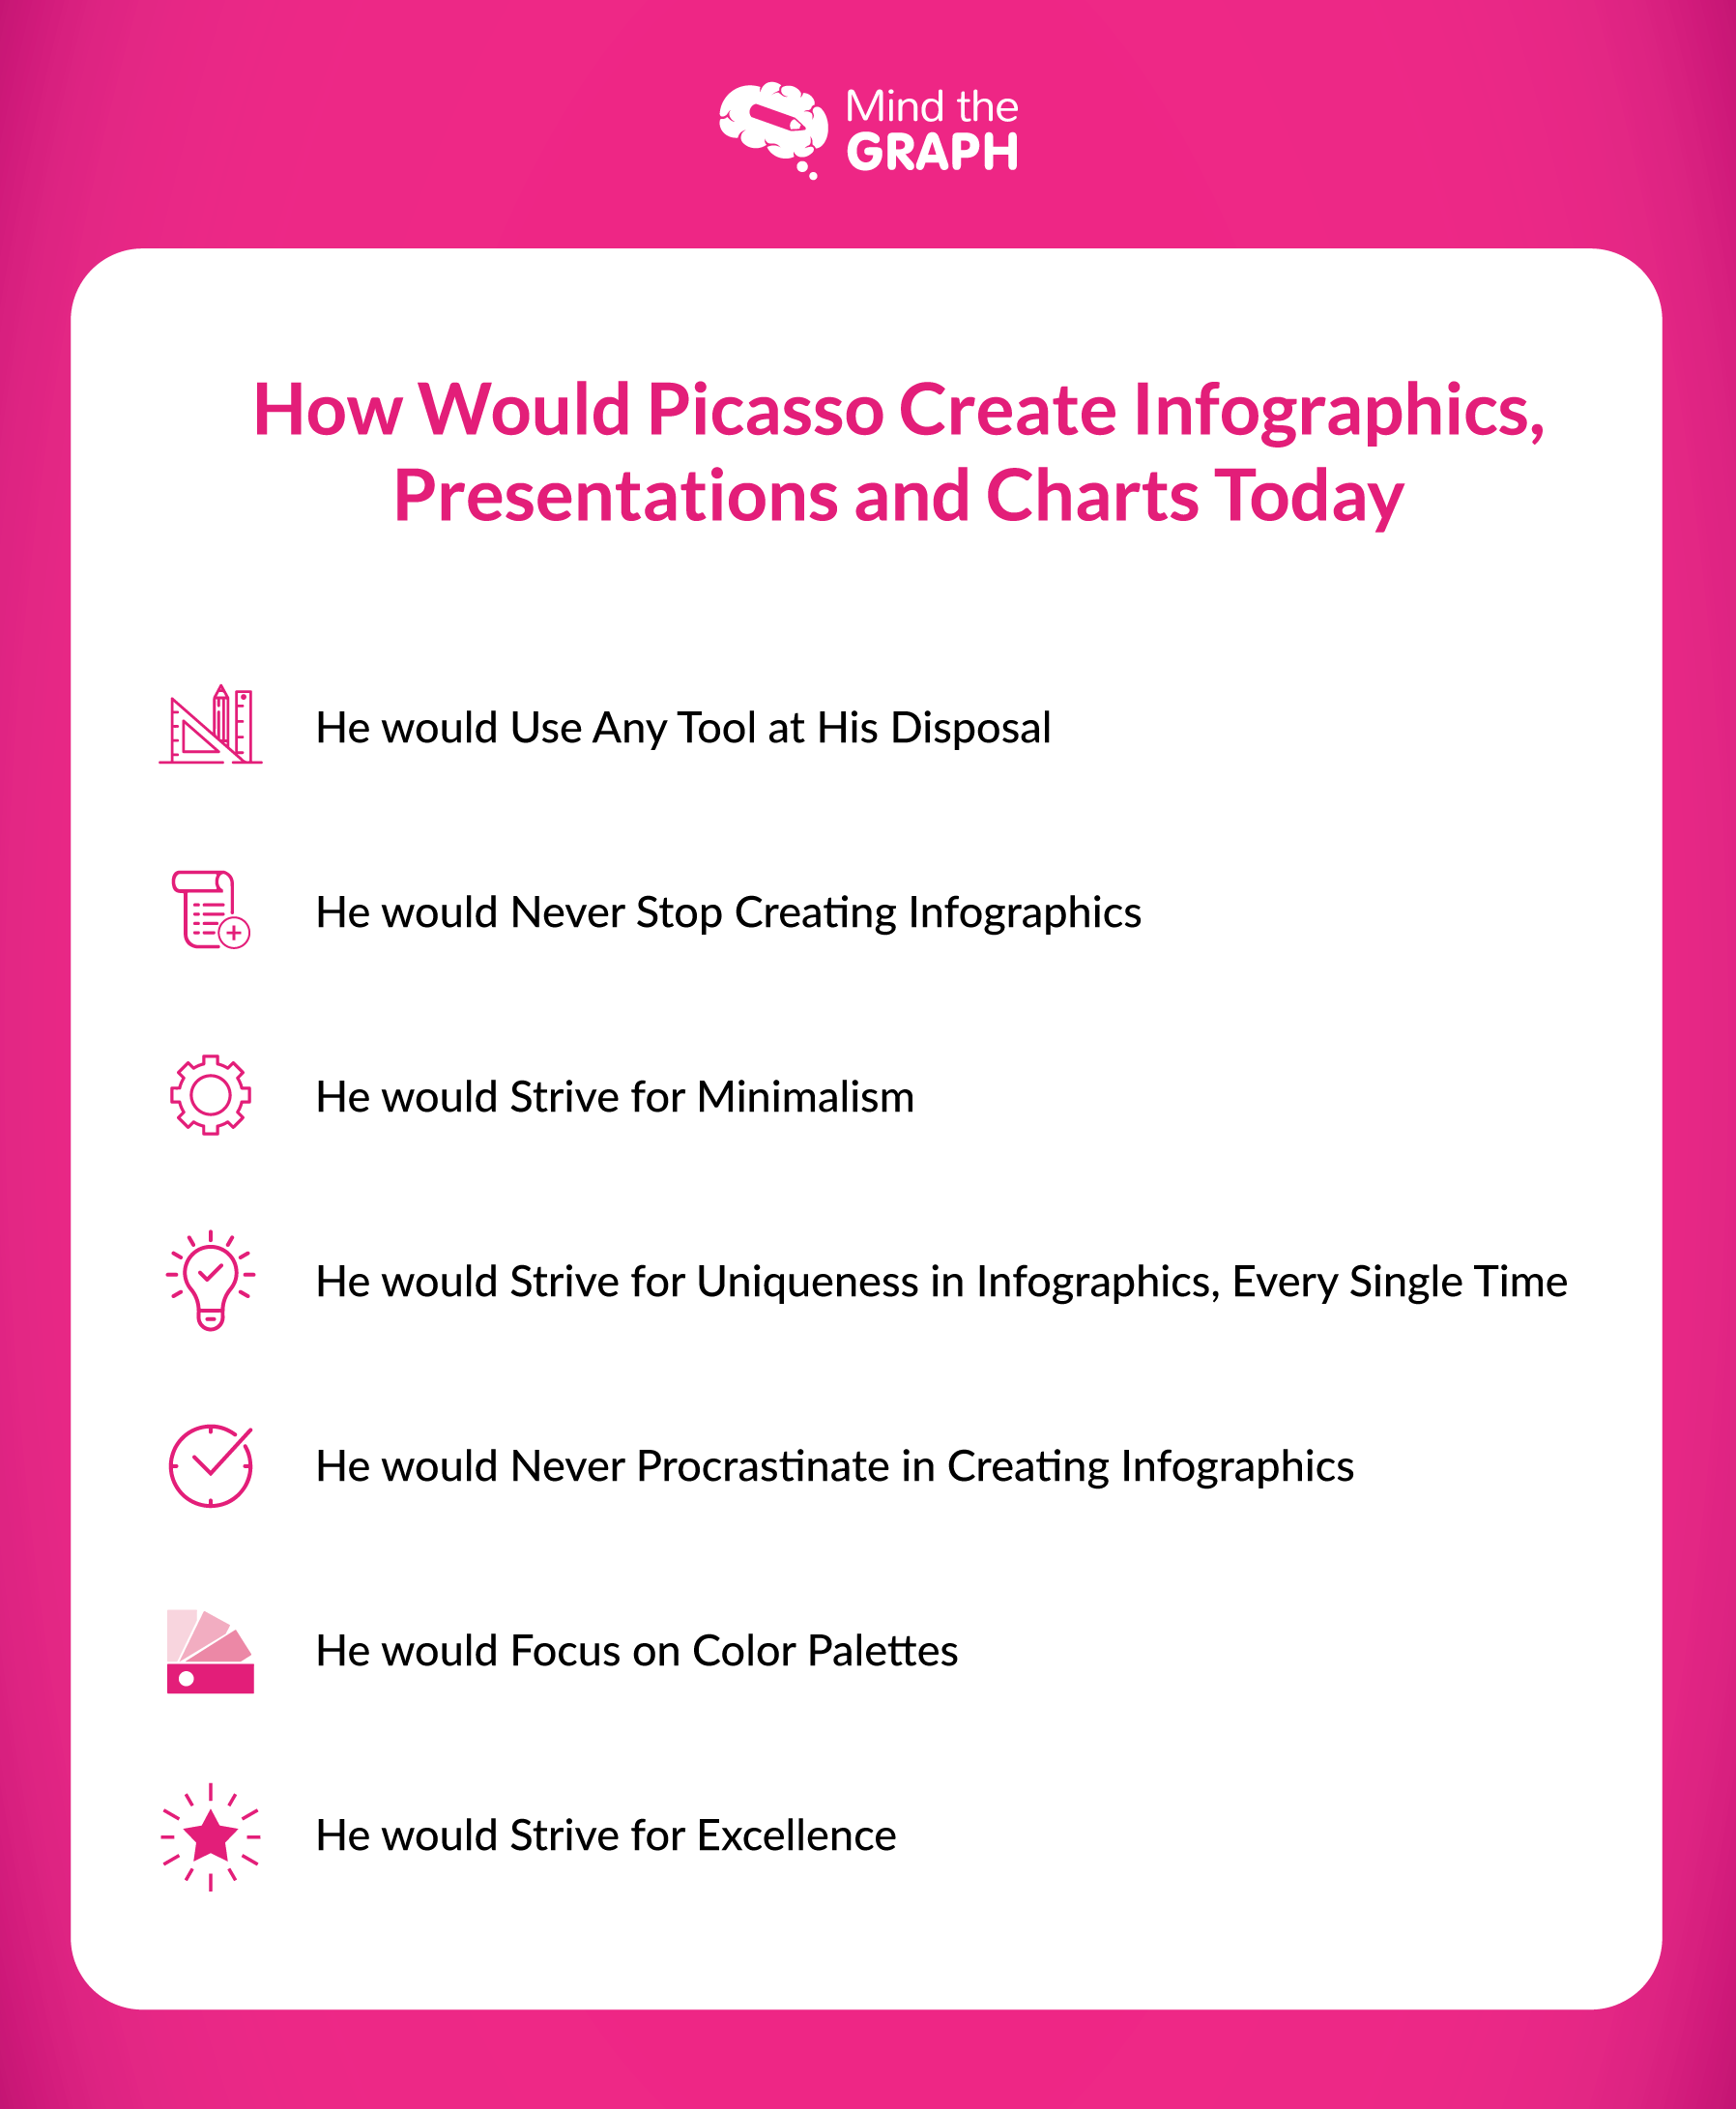
He would Use Any Tool at His Disposal
The painter was never, what you would call a fussy artist by any means. In fact, he was once famously quoted as saying that he would use blue color instead of red if that was what was available to him. He did not worry about the means – what he really cared about however was putting forth his message with as much clarity and conviction as possible.
Similar to him, while creating a graph, you have to be ready to use any and every tool that is feasible and employable for a successful and crisp communication. Mind the Graph is one such super-efficient tool that can help you create the best and most beautifully comprehensive charts for all your scientific and technical reporting. It not only helps your brand get an edge on the digital platforms with higher views and traffic but is above all, ABSOLUTELY FREE OF COST. With us, you can go ahead with designing some attractive infographics and tables with the best graph generator online.
He would Never Stop Creating
Pablo firmly believed in a thought he preached – “Learn the tools like a pro so you can break them like an artist.”
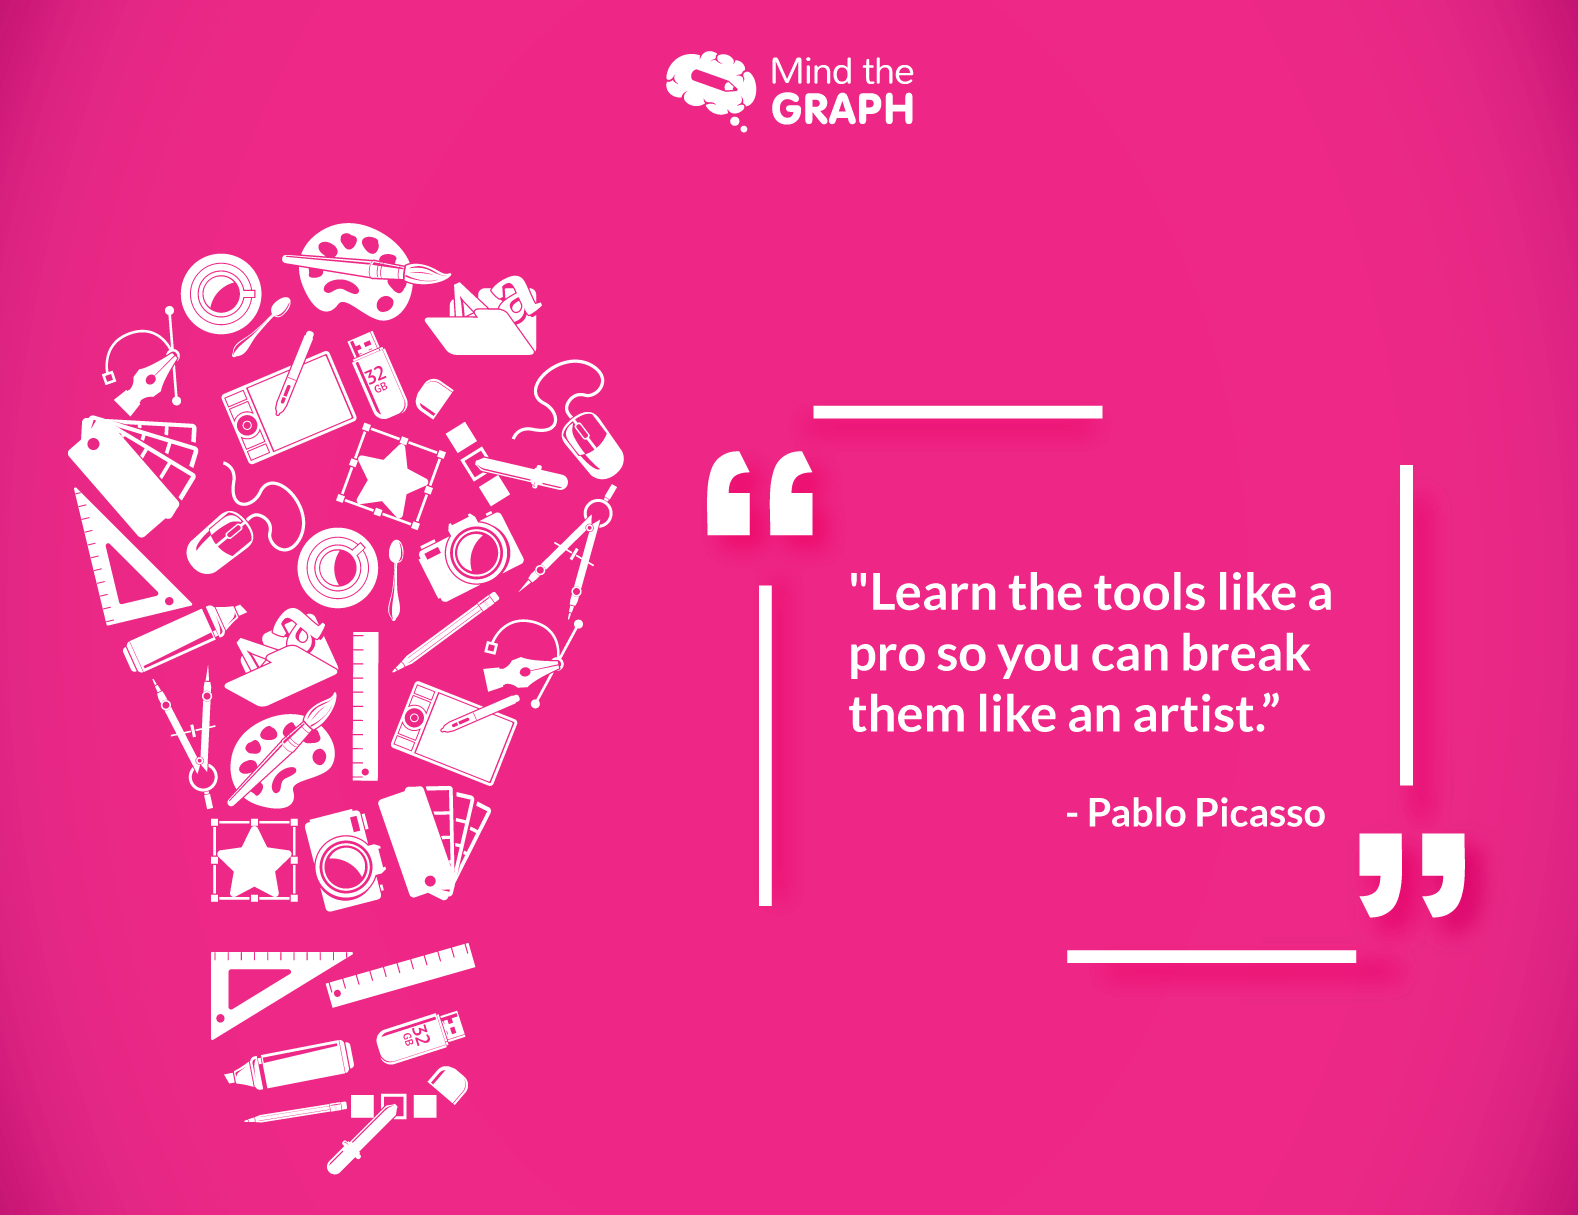
It was his opinion that to create anything, you have to first understand what you’re working with. Only once you have a complete grasp of the same can you utilize the minutest uses the “tool” has to offer while building up your own masterpiece.
He also held a steadfast conviction that one can come near perfection only by continuous practice and he wouldn’t have given up creating charts until he created the best ones out there – the ones which sent the right information to the intended audience in a way that is easily comprehensible.
Coincidently, that is also the secret behind online success – experiment! And keep experimenting till you have achieved the goals you’ve set for yourself while beginning with the creation process.
He would Strive for Minimalism
“Art is the elimination of the unnecessary.”
And similar to paintings and sculptures, to create infographics, you should be using the same approach. A pictorial representation of data in itself means you shouldn’t have to write too many words to share the message swiftly. However, oftentimes marketers, students, teachers, and researchers alike have been seen committing this error of trying to encapsulate too much information in the graph.
The resultant product is a chart that is too loud and noisy with a lot of inessential information that could have easily been made a part of the footnote instead. Not only does this bring down the visual appeal of the figure, but it also repels readers instead of attracting them, because let’s be honest – if they wanted to read so much to understand your point, they would have gone through the entire report and not just the infographic.
Simultaneously, even if a viewer is interested in the subject, he/ she might just want to take a look at the end result of your research before deciding whether or not they want to study the whole thing.
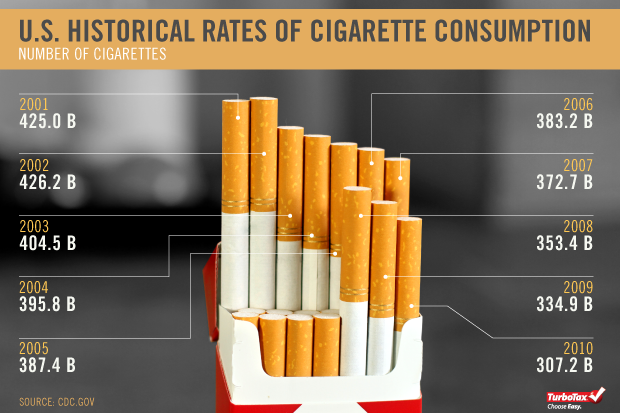
The following image for instance clearly states the facts while being minimal and creative at the same time.
He would Strive for Uniqueness in Infographics, Every Single Time
Picasso was a one-of-a-kind artist and his paintings justly also remained one-of-a-kind throughout the years. Even during his various creative periods, like the Blue Period, where he predominantly used the color blue in his paintings, each painting was different in what it conveyed to the viewer and how it made them feel.
Not unlike him, that is what you also need to strive for in your reporting. Even if the subject is one that has already been worked upon by thousands before you, what you need to show the reader is that your research is different than theirs. And the fastest way to do that is by the use of infographics. This way they can go through your results and the relations & patterns discussed in your account at a glance and understand how your study is unique in its approach. This would further lead them to actually read your record instead of skipping because of an over-used topic.
At the same time, you also have to take care that each graph that you’re creating is special and distinctive from any that you’ve made before – be it for the same paper or another piece altogether. We can understand the temptation of using the same style or at the very least a similar one as to one that succeeded before. Nevertheless, you still have to keep in mind that if you keep using the same styles, your infographics will become monotonous for the reader even if the data shared is different.
Mind the Graph can once again help you through this conundrum by offering its various distinctive templates for all your reporting needs. The decision to use these or make one from scratch will ultimately lie on you but our tools will definitely be able to help you in either case.
He would Never Procrastinate in Creating Infographics
The maestro once said, “Only put off until tomorrow what you are willing to die having left undone.”
And true to his word, when it came to producing art, be it a painting, a sculpture, or even a simple mural, he abstained from procrastination. We are sure he wouldn’t have left creating a chart for later either, unlike what you’re doing right now!
We are aware of how good it sometimes feels to just leave your task for tomorrow. Frequently, brands and enterprises have been known to do so too. They also partake in postponing brainstorming sessions over and over until its high time for a creation to be published.
Delaying your content production schedule is just going to result in becoming one of those things that you’ve got to do on a Friday evening before you leave for the weekend.
Plus you know what Benjamin Franklin said about a rushed task – great haste makes great waste!
Why not start early? Plan your outline and framework in advance and then move into the finer details of the information to be transmitted. Take your time to create some visually attractive infographics and publish them. This will further help you in understanding what works for your target audience and what is something they’d rather avoid.
He would Focus on Color Palettes
We’ve all frequently come across different colored things, dresses, places, and while looking at some have made us happy, some made us sad, some kept us calm and some made us mad. This is also what Color Psychology dictates. It focuses on the different effects the various colors can have on us.
Each color can have a different impact on a person based on the context it is used in. The color Red when made a part of a Valentine’s Day celebration signifies love, but use it in a skull on an electric meter and it instantly creates unrest in the viewer’s mind, telling them that danger lies ahead.
Using colors accurately to make infographics is immensely important to share the right message across.
As per Pablo, “Colors, like features, follow the changes of the emotions.”
And we agree!
Focus on the emotion you would like to deliver through your graph and choose colors in accordance with the same.
The following example relates to an infographic based on Christmas. Have a look at how it’s colors bring about the festive mood they aimed for.

He would Strive for Excellence
Excellence is not gifted, it is achieved.
And Picasso thought so too.
He was once quoted saying, “Others have seen what is and asked why. I have seen what could be and asked why not.”
That is the golden mantra for producing a successful infographic as well.
Cultivate in you the habit of creating these visual aids. Look at any content you’re about to publish, be it a long-form article or a short blog, and ask yourself whether this is an apt opportunity to integrate a chart therein. You will find the more you put out those graphs with your content publications, the more opportunities for online customer engagement you receive. Also, keep an eye out for what is working for the readers and what isn’t so as to take necessary precautions while making the next chart.
Final Thoughts
In the end, we would just like to remind you that while an infographic can justly be called a summarized visual representation of your work, its integration with said work is of utmost importance to enhance the attention captivity and span of the reader.
Picasso was a master at this and a master of his art.
It is your time to be the next Picasso!


Subscribe to our newsletter
Exclusive high quality content about effective visual
communication in science.