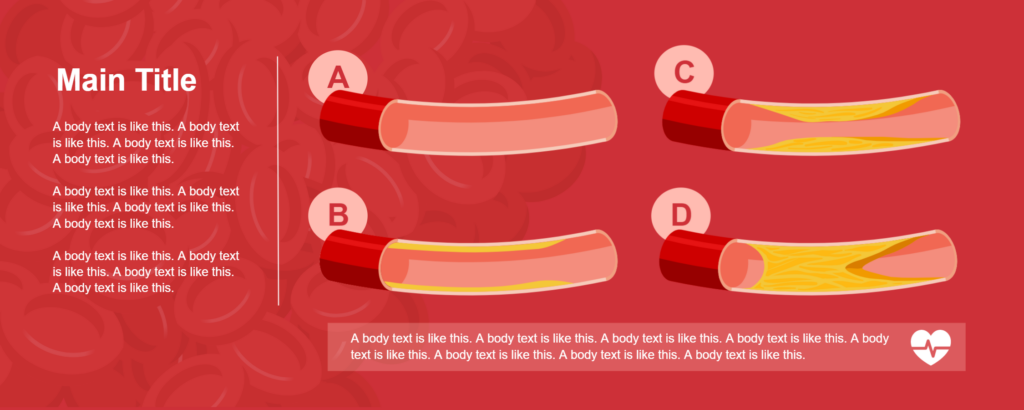
A timeline infographic is a good option if you want to show a methodology step-by-step as a lab protocol or a surgical procedure. Also is a way to explain a disease progression. Look these examples of timeline templates:
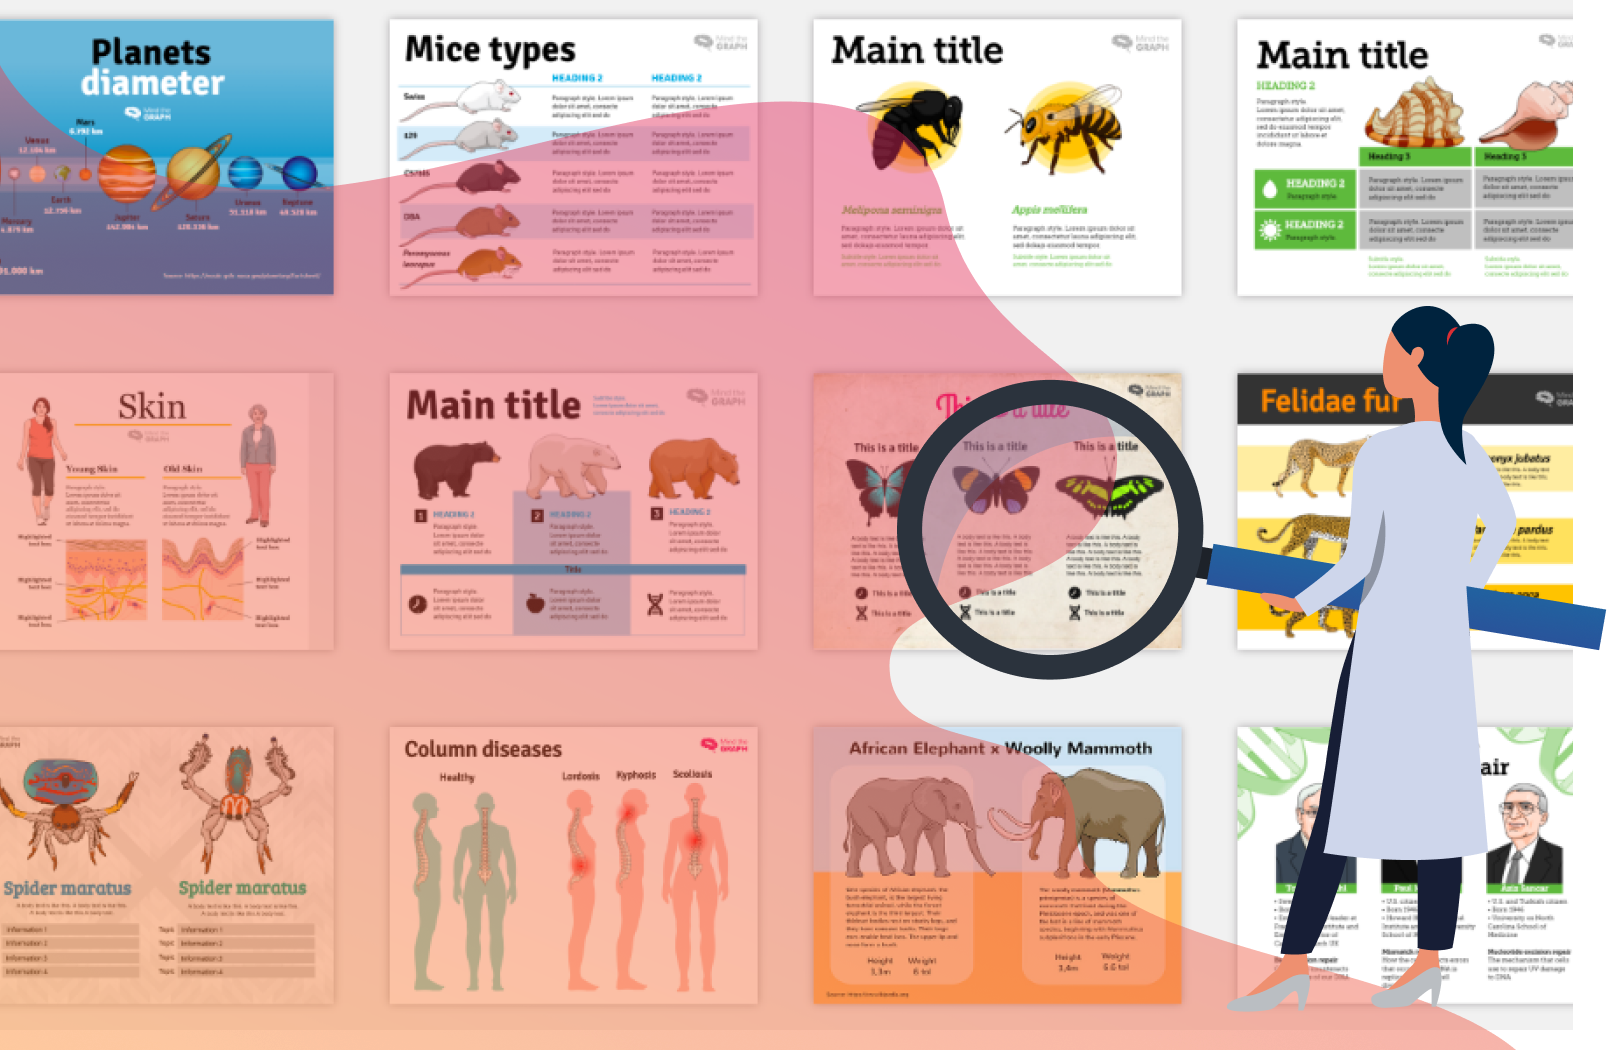
The graphical abstract template is available on mind the graph, so you don’t need to start from a blank canvas. Templates are very helpful to save time and set an arrangement. They are the best way to start a creation.
Firstly you need to choose your favourite graphical abstract template. Then change the elements and colors to have a customized infographic. Likewise you can use the templates as an inspiration to create your own model.
Additionally, if you want to know how our designers create a graphical abstract template like these ones watch our video tutorial. Watching our videos you’ll get design tips to create something professional and save time. If you are publishing a paper, creating a presentation and have a deadline to meet, video tutorials will be an ally in this process.
How to create a graphical abstract?
In this video we explained how to make a four steps infographic, but you can adapt it to fit your needs. So if you need to create a graphical abstract showing a different number of steps just change a little bit the arrangement.
Every week we add video tutorials on our youtube channel. Our designers produce videos with tips and suggestions to create a professional and attractive graphical abstract or presentation. The goal is to empower scientists and improve communication in science.
We add new videos every week. Stay tuned!
After all these tips, are you ready to start improving your presentations and publications? Start now for free:

Subscribe to our newsletter
Exclusive high quality content about effective visual
communication in science.


