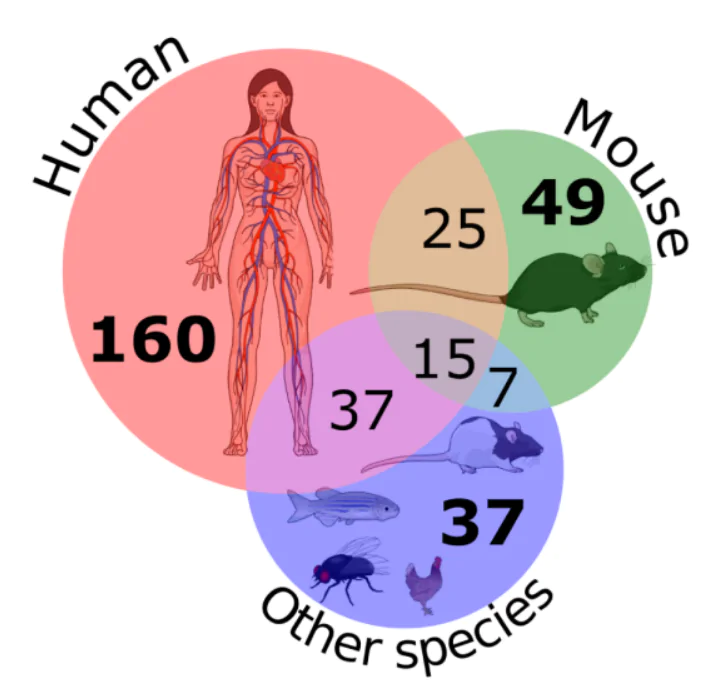
This amazing article brings out statistics summarizing data in XTALKDB. In just a few minutes, the author created an infographic explaining the distribution of the species in XTALKDB.
Check the original article here.
Since human beings are visual creatures, images are still the best way to explain your research with as many details as you want.
Scientists have developed a database that documents the crosstalk between specific pairs of signaling pathways and the species and tissue in which they are observed
A research group led by Sarah Sam of the Department of Biological Sciences (2016) reported that the perception of an external signal by receptors causes the activities of intermediate proteins to change.
This results in the regulation of transcription factors, which modulate the expression of target genes. For every pair of pathways, XTalkDB records detailed information describing the experimental conditions under which crosstalk was discovered.
Cells assess and respond to their environment via signaling pathways. A signaling pathway typically contains a well-defined set of regulatory and physical interactions among receptors, intermediate signaling proteins, transcription factors and target genes.
The XTalkDB website provides an easy-to-use interface for scientists to browse crosstalk information by querying one or more pathways or molecules of interest.
There were 650 pairs included in the study.
Graphical Abstract powered by Mind the Graph
Discussing possible improvements, “The manual curation process underlying XTalkDB has its limitations, especially as we seek to expand the coverage of the database.
We plan to develop a natural-language processing framework that will rate publications based on their likelihood to document crosstalk. A curator can then focus on highly ranked publications,” they admit.
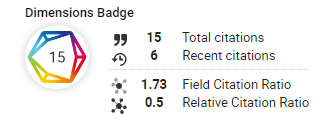
Papers Impact and Performance
We can analyze with Altmetric data that this paper is on the top portion of all metrics within all articles funded by the NIH in the Dimensions.
Use the power of infographics to boost your article as well. Try Mind the Graph!


Subscribe to our newsletter
Exclusive high quality content about effective visual
communication in science.