2 min read
08/03/2018
Mind The Graph Scientific Blog is meant to help scientists learn how to communicate science in an uncomplicated way.
How do you read scientific papers? It may seem like a trivial question. However, if we take into account that we hardly read full papers nowadays, the answer may not be so obvious. We are often looking for speed reading techniques to help overcome the amount of information we need to process. With that in […]
Hey there, science researcher! Have you ever tried to explain to general people what you […]
One of the most trending words nowadays in”interdisciplinarity”. The faster the world spins, the more […]
I’m sorry to tell you, but you could be on your way to a boring […]
Researchers have found evidence of an existing body of liquid water on Mars. A new […]
During the final materials stage of your paper, most Cell Press journals will ask for […]
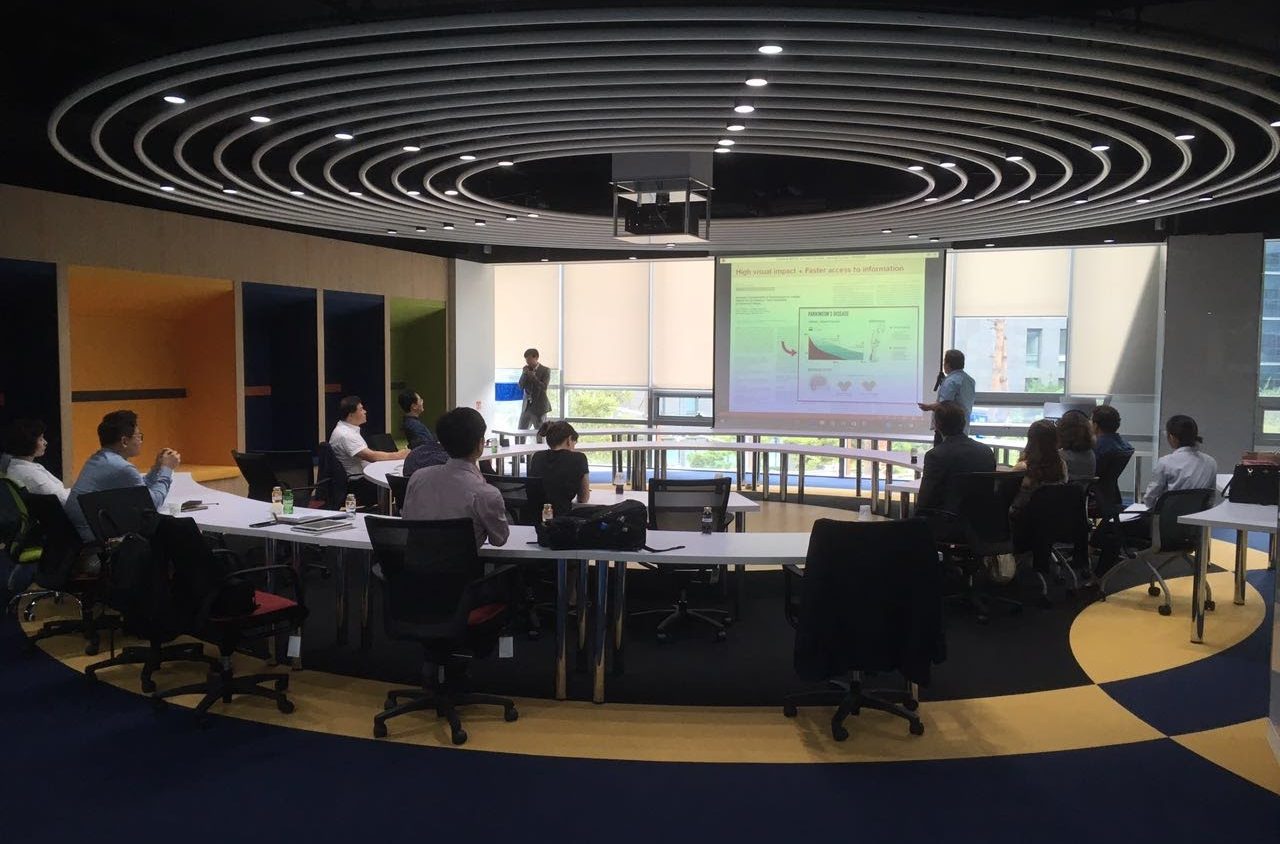
Creating a graphical abstract, infographic or presentation that is visually attractive and scientifically accurate isn’t […]
Nelson Mandela was a South African anti-apartheid revolutionary, political leader and activist for human rights. […]
Diversity improves science. Scientists should come from diverse backgrounds, including women, black and minority ethnic […]
Are you a cat person? June is the adopt a cat month and as a […]
Breaking news: during the month of August, Mind the Graph went on a mission to […]
Picture this scene: You have all your research done. The nights spent in the lab […]
May is the cystic fibrosis awareness month. Cystic fibrosis (CF) is an autosomal recessive genetic […]