
We really like to show off our users incredible work – especially if they are publishing papers using Mind the Graph illustrations and tools.
So, today we’ll show you the research of a premium user at the mind the graph, Stefania Forner. Hennes oversiktsartikkel ble nylig publisert i Trends in Neurosciences med tittelen Synaptisk svekkelse ved Alzheimers sykdom: En dysregulert symfoni. She made two Alzheimer’s graphical abstracts to illustrate her work.
First, let’s begin with a little introduction of Stefania studying field:
Alzheimers sykdom (AD) er en nevrodegenerativ lidelse som fører til kognitiv svikt og hukommelsestap. Alzheimers sykdom er den sjette største dødsårsaken i USA og rammer 35 millioner mennesker rundt om i verden.
Mye tyder på at det er en årsakssammenheng mellom de kognitive svakhetene ved Alzheimers sykdom og tap av synapser. Synapsedysfunksjon kan også være relatert til to patologiske veier. En ekstracellulær akkumulering av beta-amyloid peptid og intracellulær akkumulering av tau-protein.
Det er kjent at disse to prosessene spiller en viktig rolle ved Alzheimers sykdom. Et av de store, grunnleggende spørsmålene som gjenstår, er imidlertid knyttet til det molekylære forholdet mellom beta-amyloid og tau, og hvordan disse to aktørene gjensidig forårsaker svekket synaptisk funksjon ved Alzheimers sykdom.
For å analysere tau-proteinets og beta-amyloidpeptidets innvirkning på synaptisk funksjon og Alzheimers sykdom hver for seg, brukte Stefania to grafiske sammendrag hun laget på Mind the Graph-plattformen. Den ene viser dannelsen av beta-amyloide oligomerer og mekanismene for synaptisk toksisitet, og den andre viser sammenhengen mellom tau-protein og synapser i nevroner.
Grafiske sammendrag om Alzheimers sykdom

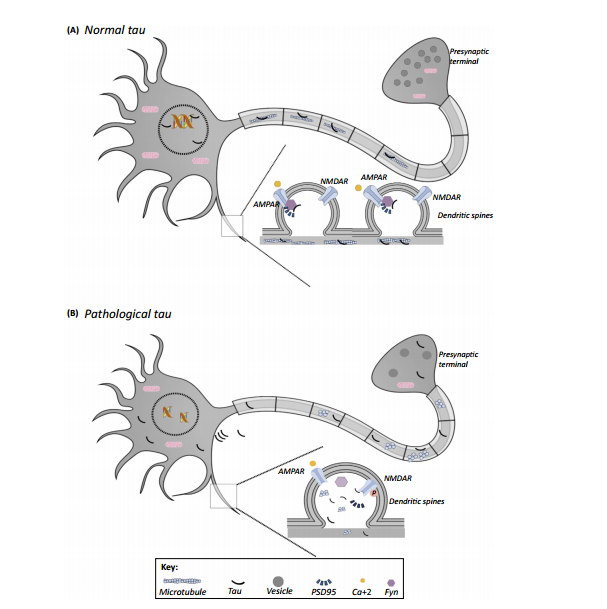
"Studier som har undersøkt det molekylære forholdet mellom Aß, tau og synaptiske mangler og/eller tap, har kastet lys over hvordan disse patologiene til syvende og sist kan føre til kognitiv svikt hos pasienter. Identifiseringen av flere potensielle pre- og postsynaptiske veier kan bidra til de underliggende kliniske symptomene på Alzheimers sykdom."
Jeg vil også ha grafiske sammendrag av forskningen min!
Grafiske sammendrag er en måte å utfylle og illustrere hovedpunktene i arbeidet ditt på. Hvis du har lyst til å lære mer om hvordan du selv kan lage flotte grafiske sammendrag, finner du her et par innlegg som kan hjelpe deg:
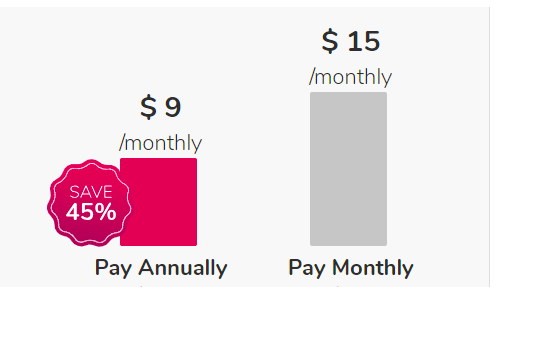
You can start using Mind the Graph for free. We have a Free version in which you can give it a try and access our scientific library. Premium users have full access to the platform and special benefits as you can see here.


Abonner på nyhetsbrevet vårt
Eksklusivt innhold av høy kvalitet om effektiv visuell
kommunikasjon innen vitenskap.