3 min read
12/03/2015
Mind The Graph Scientific Blog is meant to help scientists learn how to communicate science in an uncomplicated way.
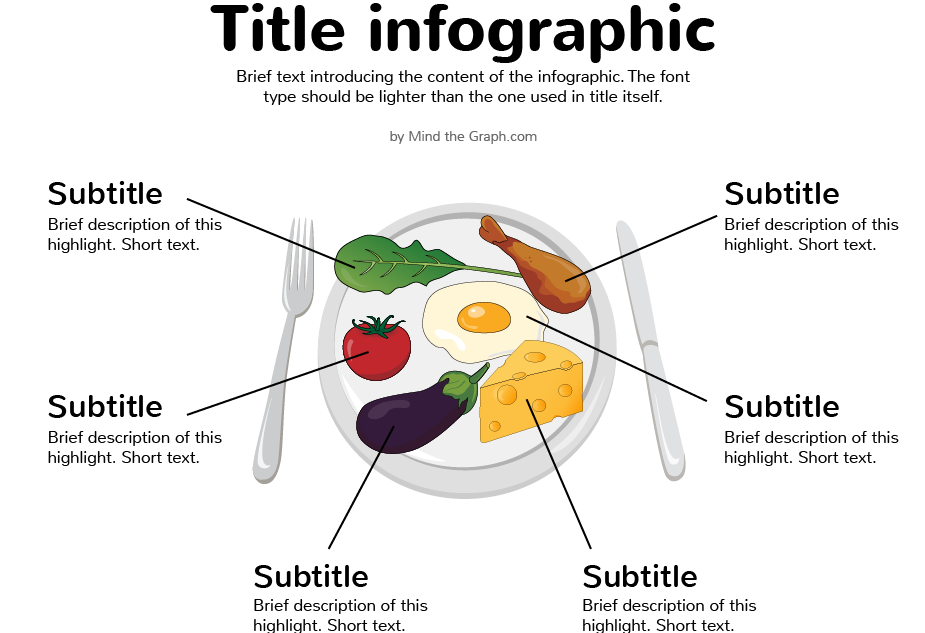
This post is part of a series of educational material aiming to provide qualified information for scientists and health professional that want to communicate using infographics. Know why infographics are a great tool for your scientific communication. If you prefer, download your pdf copy of “The Ultimate Guide of Scientific infographics” by Mind the Graph. What’s […]
The information, the story, is the most important part of your infographic. as we already […]
Infographics must employ an organization that literally “talks” with the story. Keep your objective in […]
Believe it or not, the idea is the main aspect of an infographic. You […]
Whether we like it or not, with the advent of the digital age, the amount […]
1- There is a lot of money involved Billions of dollars are spent on direct-to-consumer […]
A classic is a classic. However, it is difficult to define what makes something a […]
Public sector funding of synthetic biology projects is rising each year, and the numbers from the […]
Bias and cognitive fallacies. These are the most dangerous traps that a scientist should avoid. The […]
Coffee, is it good or bad for our health? This kind of question is not […]
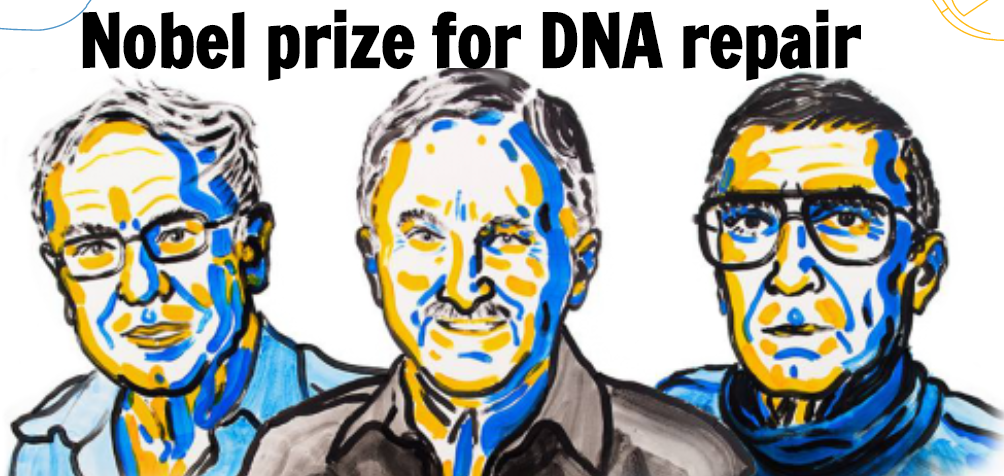
The Nobel Prize is not only a way to recognize great researchers, is a way […]
The Nobel prize 2015 in medicine was awarded to three scientists that have studied treatments […]