2 min read
09/05/2019
Mind The Graph Scientific Blog is meant to help scientists learn how to communicate science in an uncomplicated way.
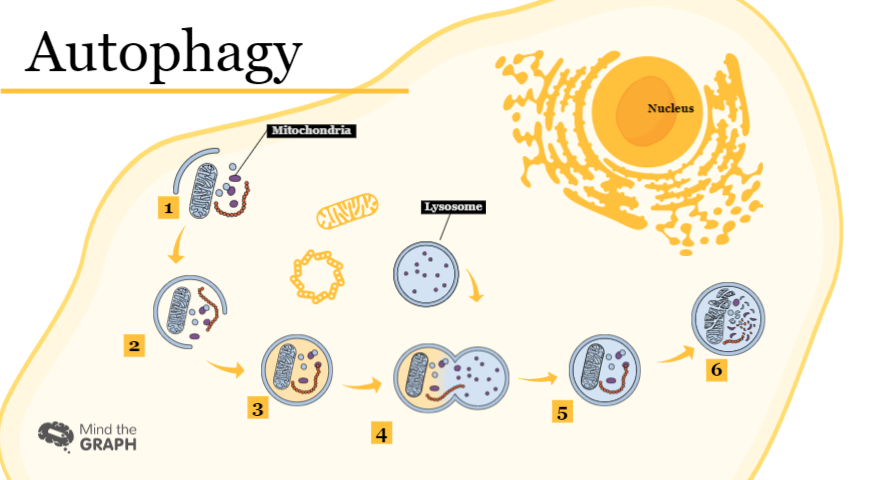
Visual resources are powerful to communicate better in science. Scientific illustrations are a good example of it. Using illustrations you can show details, explain process and pathways and your audience can visualize what you are saying. Also, illustrations cause less impact than a photography. So, you can use them to explain surgeries or medical procedures, […]
As you probably know at this point, we are have the biggest library of accurate […]
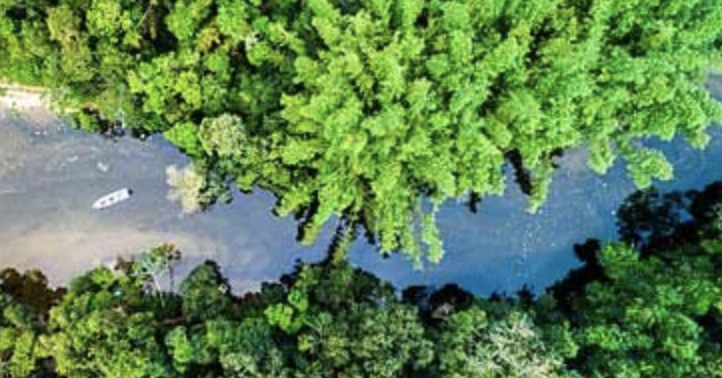
The last days were tough, right? The wildfires in the Amazon rainforest become a trend […]
Escrever um artigo científico é um passo muito importante da vida científica. Afinal, você precisa […]
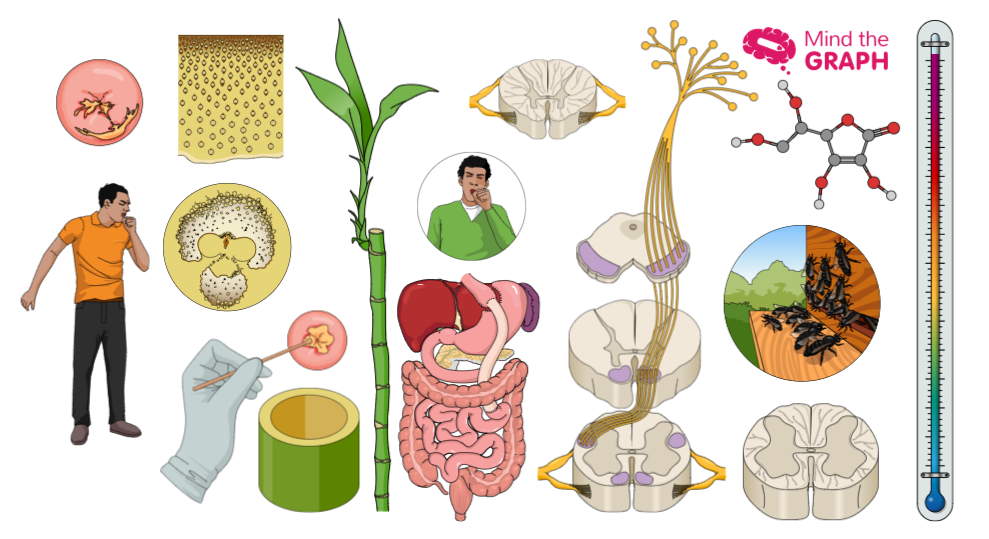
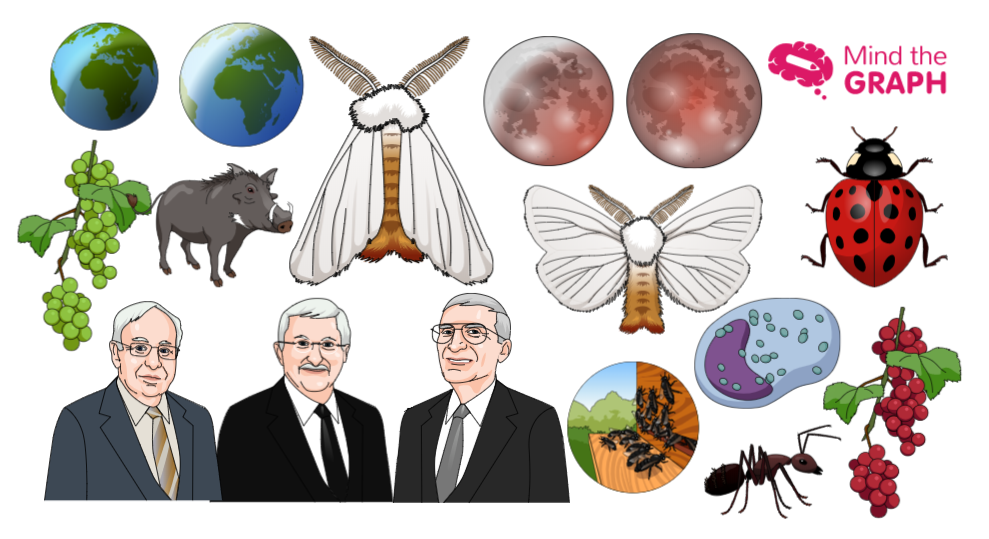
Hi there! Are you ready to see the new scientific illustrations? We have a lot […]
We can see the immensity of rainforests looking at pictures of the tree tops take […]
The Amazon rainforest is the most biologically diverse place on Earth. Of all the known […]
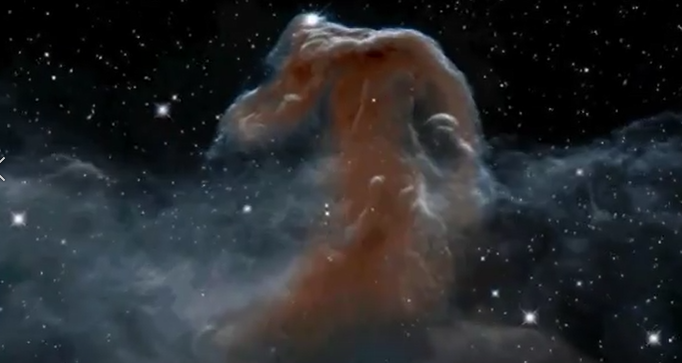
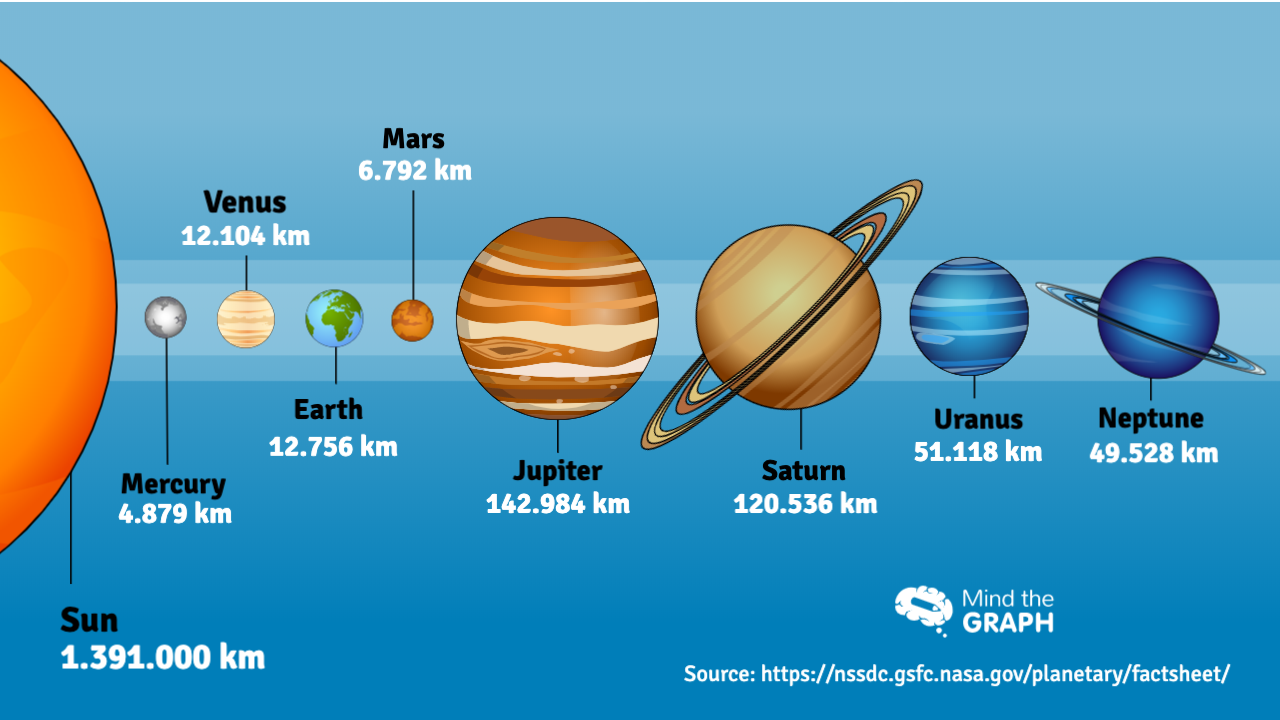
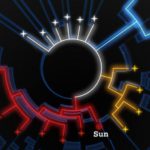
How big and diverse are the universe? Well, this is a tough question even for physics. […]
Embrace yourself, the weekend is coming! It is friday again and we are waiting for […]
Hi there! We have new scientific illustrations for you! Every friday we show waht is […]
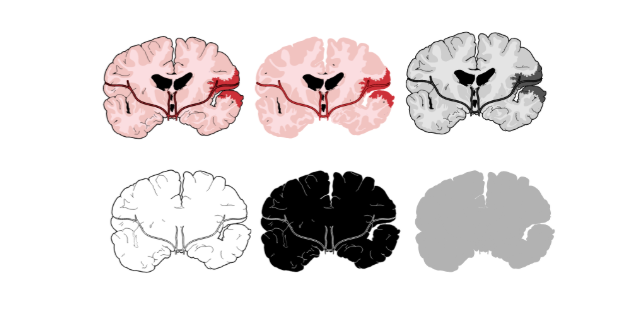
This post is about a very serious and important topic. Each year nearly 800,000 people […]
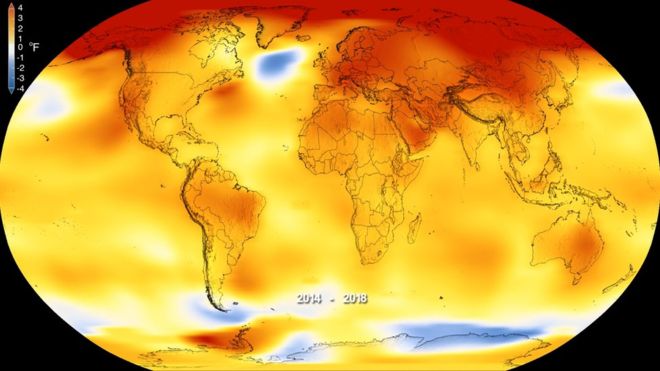
Climate change is being a controversial subject these days. We can see all over social […]
Hi there! Being a scientist means to be updated in everything about science. Even more, […]