There is an outdated ideia that the life of a scientist is to be isoled, making experiments just for curiosity. Actually, we need to communicate and share results to get funds for our research and impact the scientific world and the society in general. Thus, it is very important to know how to present scientific data. More and more professors are requesting images with high quality to their students. Also, many scientific magazines are requesting graphical abstracts to publish a paper. If need to create better graphical abstracts too, you can use mind the graph to create professional graphical abstracts and presentations to your scientific data.
We have many students that use mind the graph. However, you know scientific life isn’t easy and sometimes it’s hard to find the money to invest in our work. Because of that, many professors encourage their students, supporting the financial cost to use the platform. Moreover, it’s very easy to get an invoice, so the University itself reimburse the payments.
Thus, if you are a professor and want to improve how your students present their work, write to us. We’ll provide all the support your students need to learn how to create better graphical abstracts and presentations. Thus, they can enjoy our library with thousands of scientific illustrations. Also, we provide invoices with all financial details you need to be reimbursed from University.
Look some benefits of being a premium user:
Request new illustrations ‘on demand’
The “on demand” service is the major difference between Free users and Premium users. If you don’t find the illustration you need, no worries! As a premium user, you can request new illustrations at no extra cost.
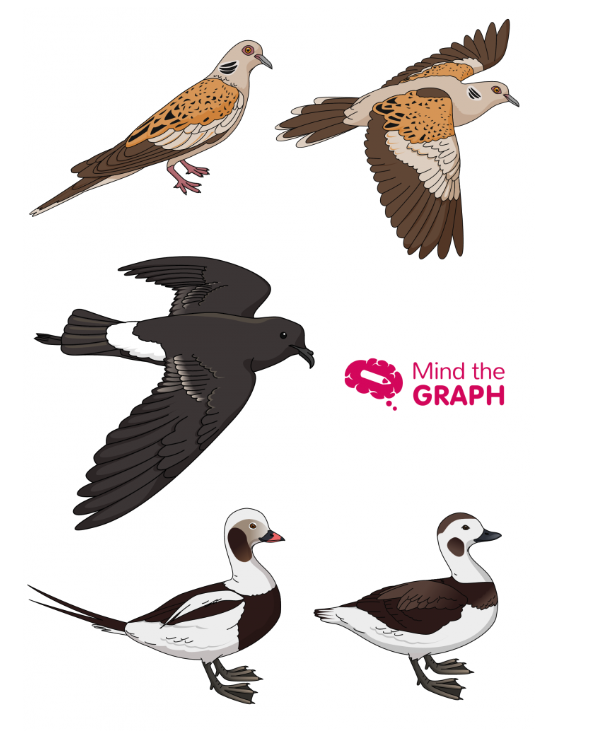
“Many thanks for the previous bird and parasite icons which look very good! Today I would like to ask for 3 more bird species:
- European Turtle Dove (sitting and in flight if possible)
- Wilson’s storm-petrel (in flight)
- Long-tailed duck (male and female)”
Keep images in private mode
You will create a profile on Mind the Graph that can be used as a portfolio of your creation and your data. However, if there is any creation you don’t want to share, you can put in private mode. It’s possible to choose public or private mode for your creations only if you are a premium user. All creations of free users are in public mode.
Create presentations
An important part of being a scientist is to participate of scientific congress and present new results. However, it is not always easy organize the information in a beautiful way to catch your audience attention. With mind the Graph you can stop boring presentations. Premium users have an unlimited number of slides available.
Unlimited uploads of images
You can upload your images to mind the graph and use in your creations. Thus, if you want to import your scientific data and charts or any other image, the premium plan is the best option for you. Free users can upload only 1 image.
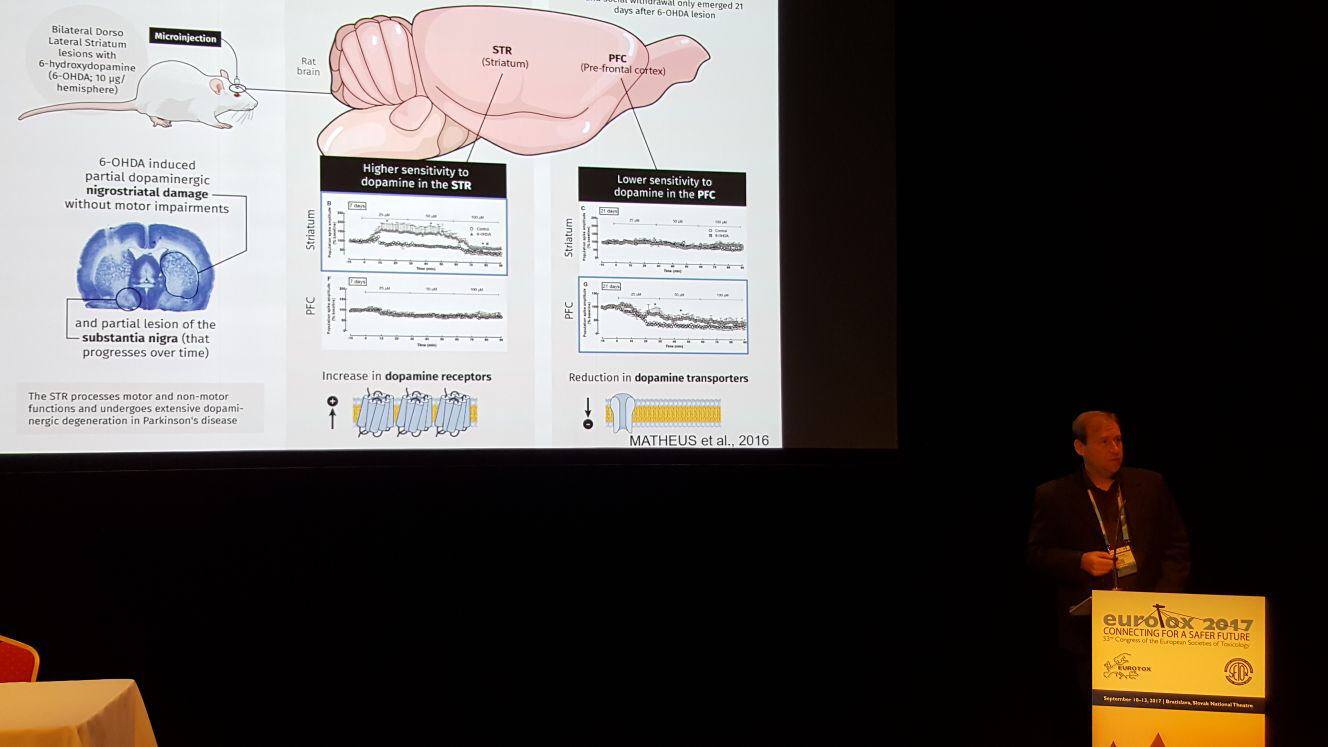
As an example, look this beautiful infographics with 5 images uploaded bu the user:

If you want to see more benefits of being a premium user click here. But if you feel ready, you can start now:


Subscribe to our newsletter
Exclusive high quality content about effective visual
communication in science.