Infographics in Healthcare
How many times did you find yourself reading flyers in the waiting room of your doctor’s office? You read the flyer and think “Good to know that”. Many times, right?
Because of that simple habit, science communicators need to reflect and discuss more and more about the importance of infographics in healthcare
Infographics are one of the most powerful ways to communicate complex data, and it is an important tool in teaching, giving inspiration, presenting information, and business. We can define infographics in many ways, but one is a visualization of data or ideas that try to convey complex information to an audience that can be quickly consumed and easily understood.
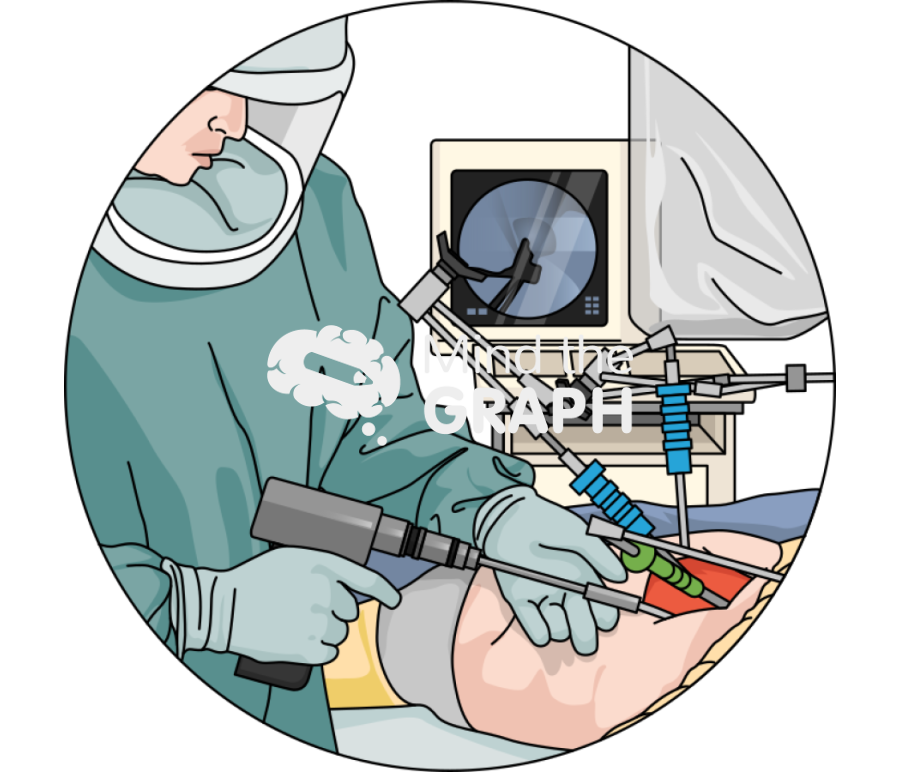
In healthcare specifically, infographics have an important role in informing patients. Procedures and pathological conditions are just a few types of information that are communicated through infographics. Therefore, it is important to focus on the relevant facts in isolation, and unnecessary or distracting images should not be present in the final design. This will decide the success or failure of the infographic in communicating certain data or knowledge.

What is the role of Infographics in Healthcare?
Since the cave drawings, when cavemen used information design unconsciously, modern professional designers consciously incorporate the principles in the design process.
Just like the flyer in the doctor’s office, if you have read a newspaper, blog, magazine, you have probably come across infographics. Even on social media, Twitter, Instagram, Linked In, or Facebook, infographics are everywhere. All contained pictorials that tell you about the gist of the story or concept at a glance.
Infographics have wide-ranging applications beyond news dissemination, such as scientific visualization, product design, education, information technology, business communication, and entertainment.
Infographics are graphics that visually transmit information and data accumulation. When preparing this information design material, the main goal is to transfer intensive and complex information to the target group easily by reflecting the contents of the subject.
If the viewers understand, learn, and grasp the design quickly and easily, the infographic fulfills its role.
In the end, the reflected information needs to be remarkable, esthetic, engaging, and appealing.

Why are infographics important to public health?
In Healthcare, infographics are powerful digital tools that enable patients to have the required knowledge to understand information on specific diseases, procedures, and trending healthcare topics. In other words, infographics should be innovative and designed to transmit important information to patients.
Creating impactful infographics is an educational experience for patients, enabling them to know a complex message in a way that enhances their comprehension.
Once patients understand that infographics are powerful digital tools that provide numerous insights into specific diseases, procedures, and hot healthcare topics, the exchange of information between clinicians and patients will be much more accurate and safe.
So, Infographics in healthcare must have the intent to translate complex healthcare information into simplified graphical snapshots that will leave the reader with a better understanding of how a disease can occur, be treated, and possibly, even prevented.
For example, visual aids such as infographics can help educate patients, their families, and others seeking cancer information. However, to ensure the integrity of graphics and text in the created informative designs, the design must maintain close contact with the doctors. Mutual interaction is key to successful illustrations that reveal aspects that words are unable to express in a single frame.
There is a reason why we can perceive images faster than writing, how the brain gets the information.
Our brain evaluates all of the information in the form of pictures but treats the text in a line. Now, due to infographics, the process of communicating information becomes easier and more efficient.
Informational graphics have a more powerful effect, and they emphasize the relationship between two subjects, such as graphic design and health.
What type of information a healthcare infographic can inform?
- Causes and risks related to a disease or condition;
- Facilitates the detection of where the disease is spawning;
- Diseases processes;
- About a specific disease;
- About healthcare topics;
- About treatments;
- Prevents actions.
How do I make a healthcare infographic?
Despite the purpose of the infographic, there are a few factors that must be considered to its creation:
- Do not leave space for doubts about theme, story, or main message. All information must be clear! The infographic and its subject need to be highlighted. It must be considered and discussed before the design process occurs.
- Consider and think about (or like) your audience. They are the ones who are supposed to understand the message of your infographic. Keep them in mind to make the infographic more visually appealing, focusing on size, simplicity, effective use of data, and the overall impact.
You must not have a big scope of information in one infographic. Create more than one if you must, and remember, the attention span of the average user is increasingly short. For that reason, the question that the infographic is answering should be designed carefully and answered with the most effective method available. If you consider all these factors, the visualization of your infographic will be more effective and imaginative.
- Font selection is an important point that should be addressed. Elaborating fonts can make reading difficult and turn out to be distracting, particularly for elderly patients. It can be difficult to choose a font, however, keep in mind your audience’s needs. Large and legible fonts are always the best choice, especially when your audience are patients with vision illness.

- Choose colors that enhance the information. Color is a remarkable communication tool that plays an important role in design. The right color has the power to enable design elements to stand out, increasing the effectiveness of a piece of communication. For example, if a heart symbol is used for a cardiology department, the most called color should be red, reflecting the item and making it easier to memorize.
Choosing colors that highlight information is an important aspect of graphic design. Color makes the information provided more legible and determines the visual hierarchy of information. That is why choosing the right color is so important. Contrast is a key factor, as the background should blend well with the illustrations.
Mind the Graph Ready Templates
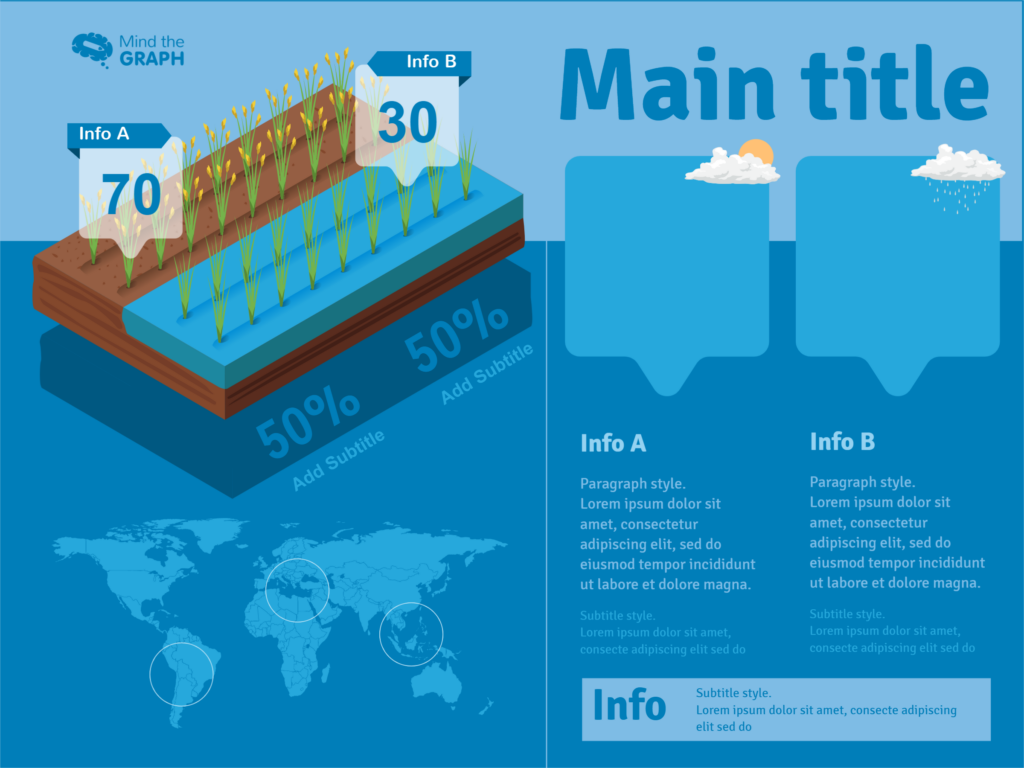
Check out below Mind the Graph ready infographic templates, and how the color is related to the infographic theme. If you liked the template, click on it to use it.
Blue for water themes.
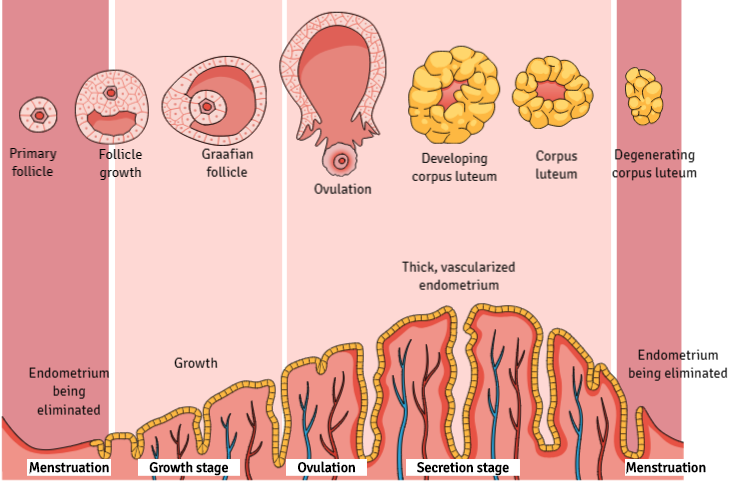
Smooth pink for the sky, and green for the grass round.

Red for blood-related topics.

Now you understand the importance of infographics in healthcare. Are you ready to start creating infographics for your patients?
Click here to start!
Reference


Subscribe to our newsletter
Exclusive high quality content about effective visual
communication in science.