3 min read
02/27/2019
Mind The Graph Scientific Blog is meant to help scientists learn how to communicate science in an uncomplicated way.
If you are a free user of Mind the Graph, you probably noticed that the account is limited. You can be a free user as long as you want and we’ll never charge you for that. However, if you feel that you need to create more complex illustrations for your visual abstracts, you should upgrade to an […]
Mind the Graph is an online platform that allows scientists to create beautiful and accurate […]
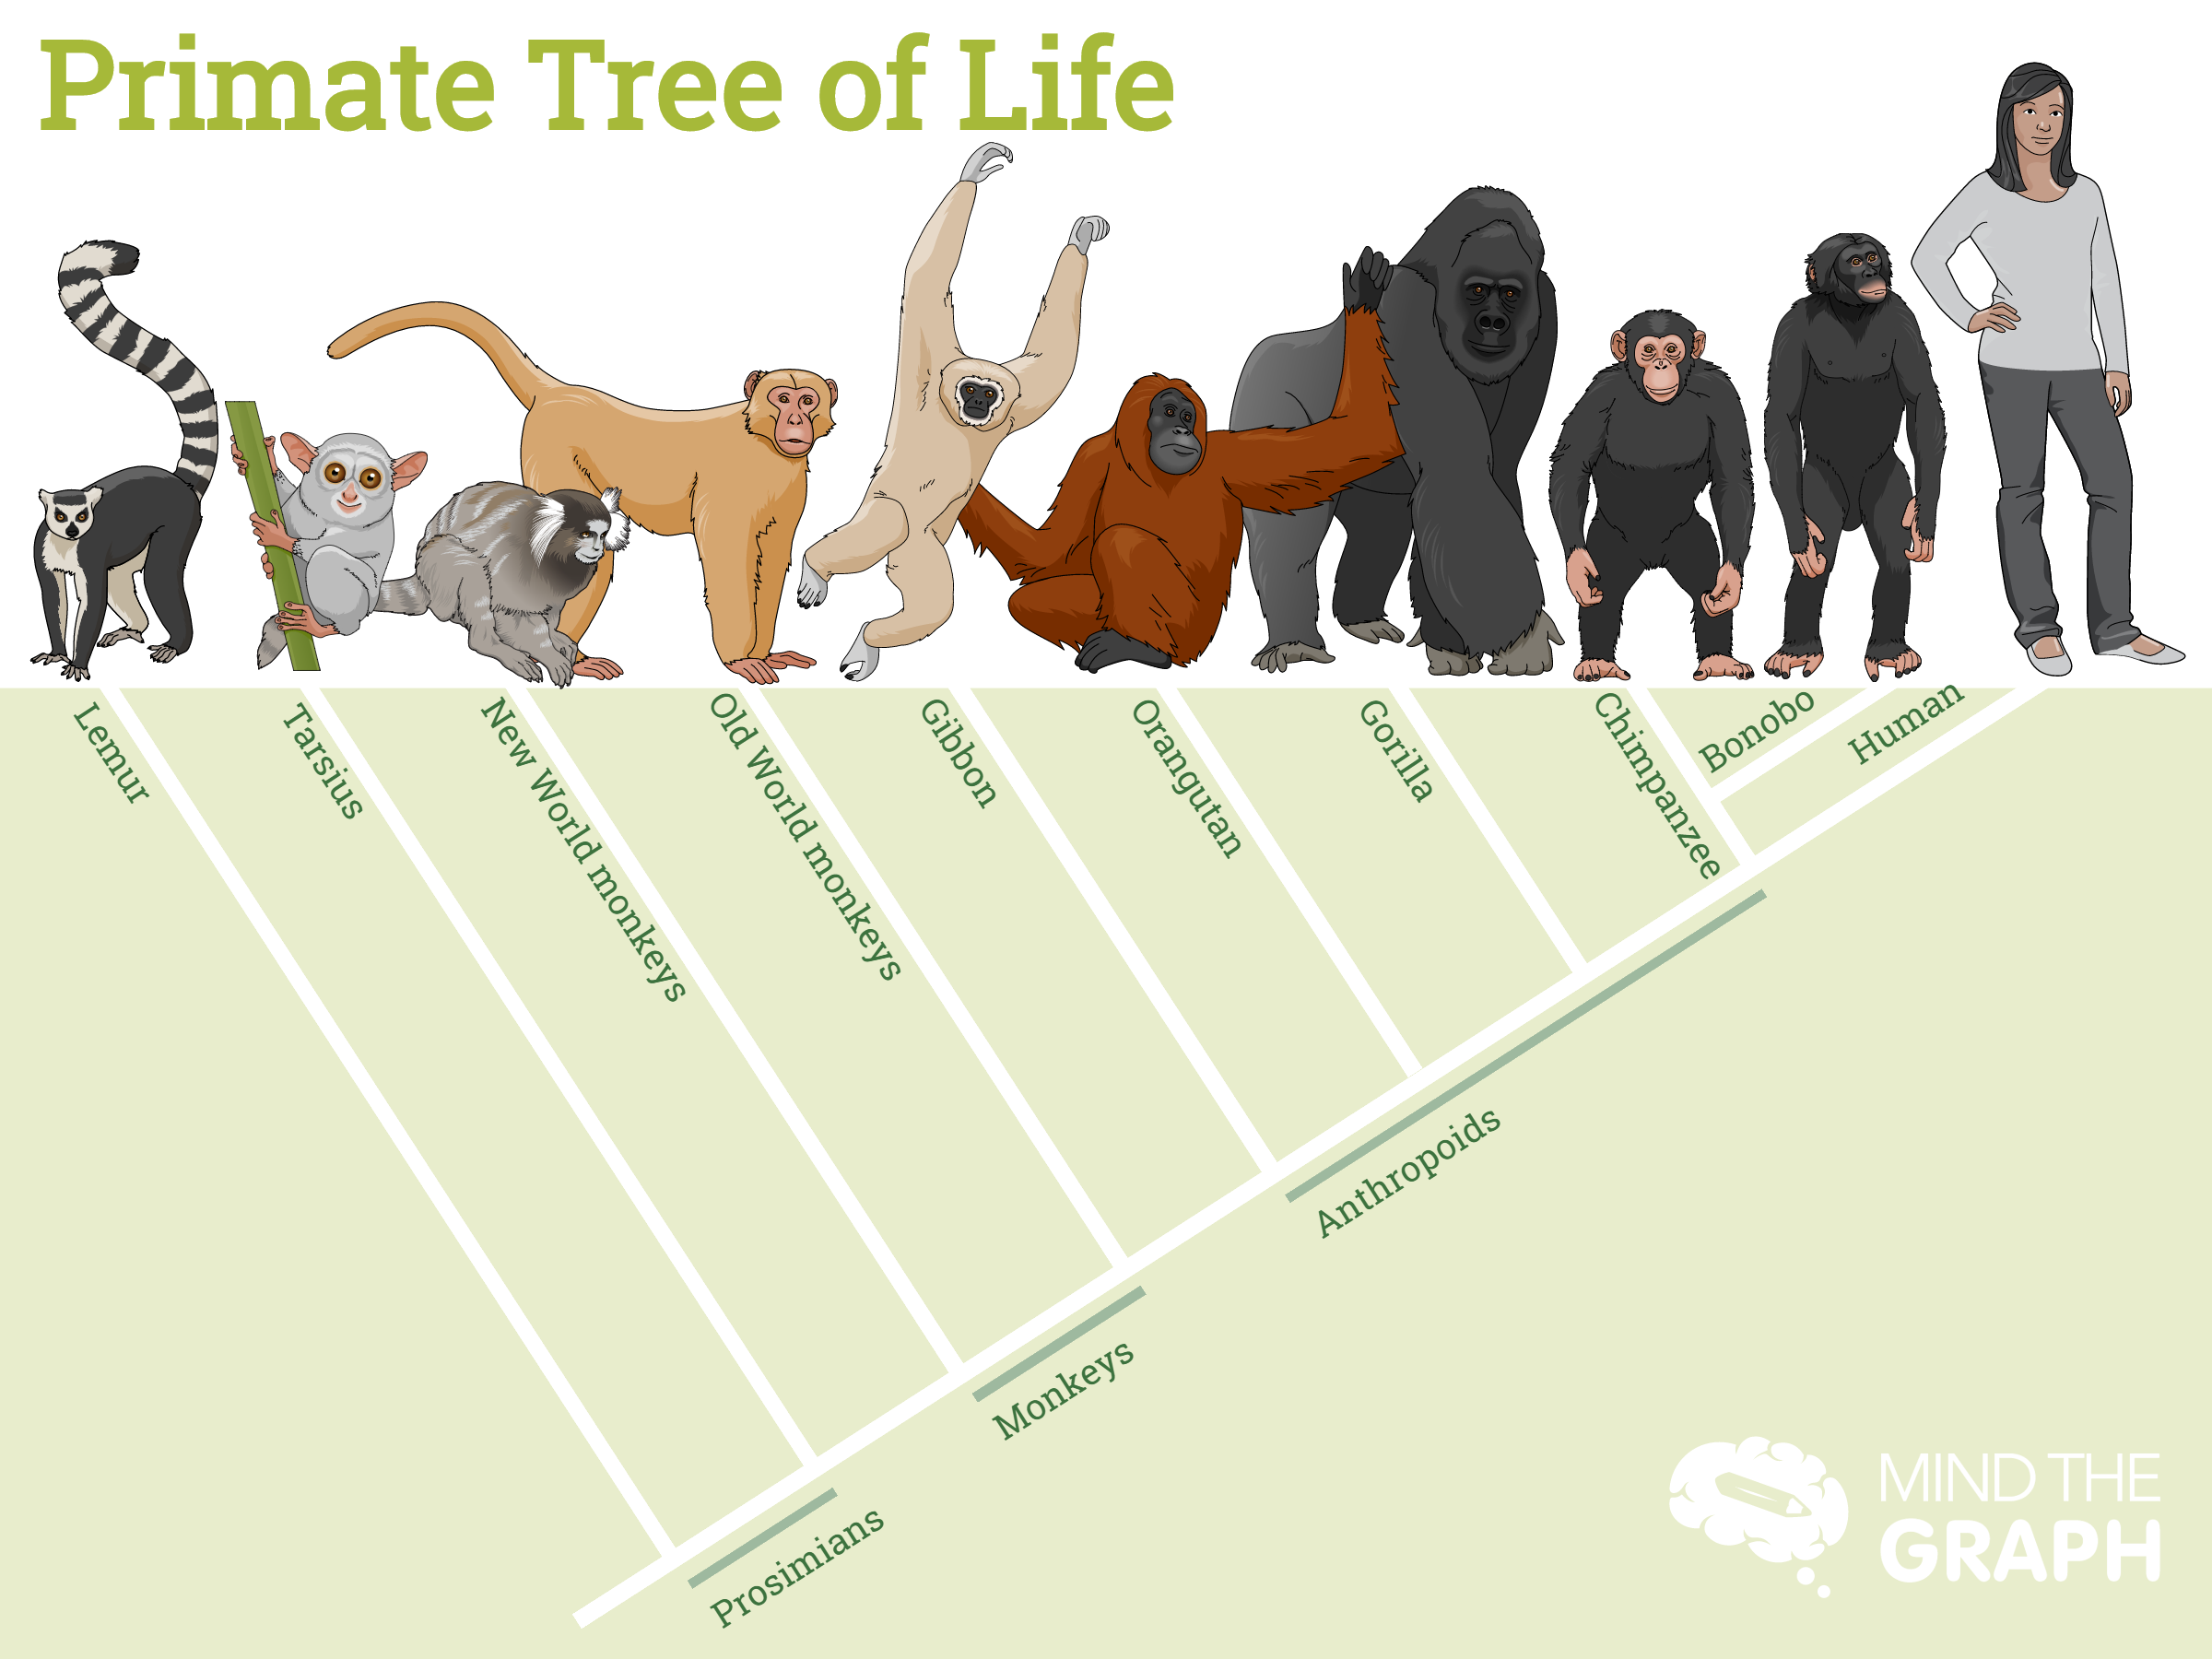
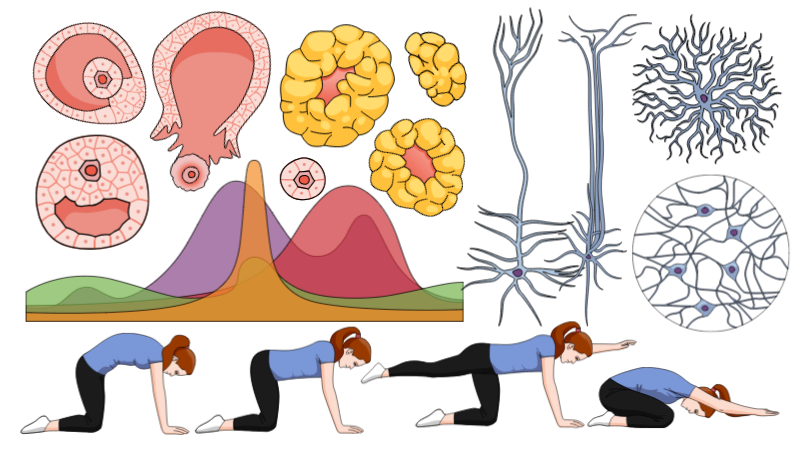
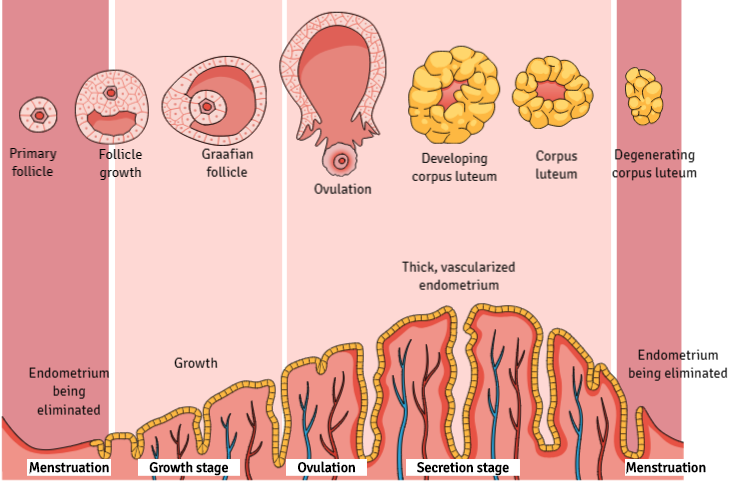
It’s time to show you the new scientific illustrations that we created this week. Every […]
As ilustrações científicas são uma ferramenta poderosa para comunicar em ciência. Como espécie visual, aprendemos […]
Vitamin D is responsible for increasing intestinal absorption of calcium, magnesium, and phosphate. Unlike other vitamins, […]
As you know, we add new scientific illustrations every week in Mind the Graph. We […]
Happy women in science day! The gender balance in science and tech is notoriously uneven, […]
Hello! As you know, we add new scientific illustrations every week in Mind the Graph. […]
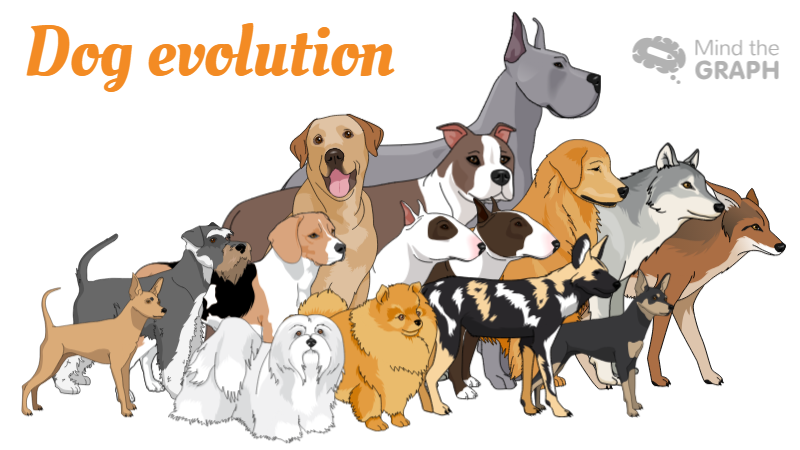
Dogs are people’s best friends and they evolved close to us when wolves and humans were […]
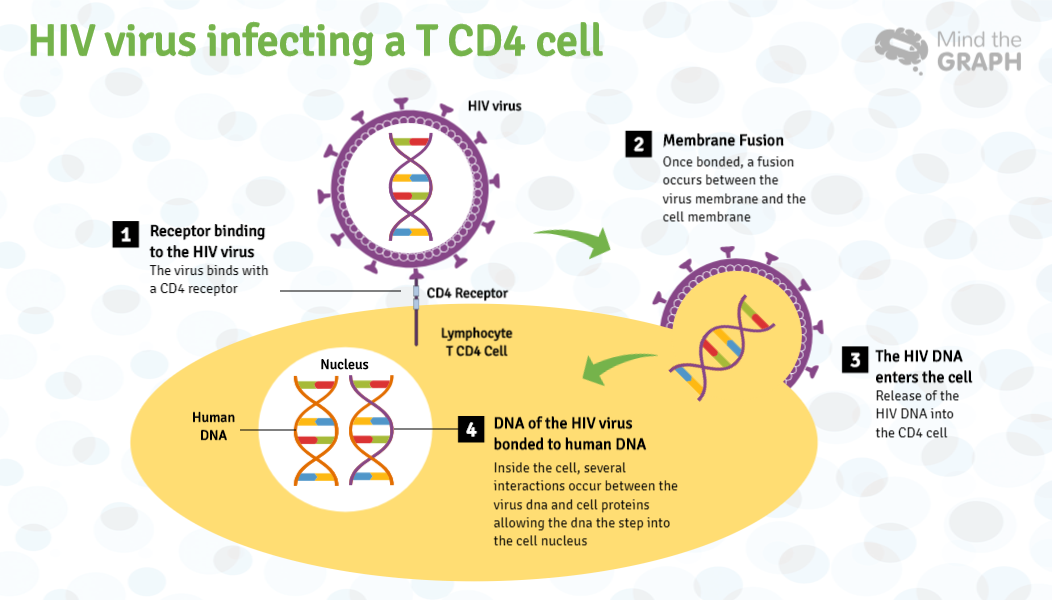
World AIDS Day, occurs every year on 1 December since 1988. It is an international day to […]
Being a scientist means to be updated in everything about science. How often do read […]
We always love to show off our users amazing work. Empower scientists to enable a […]
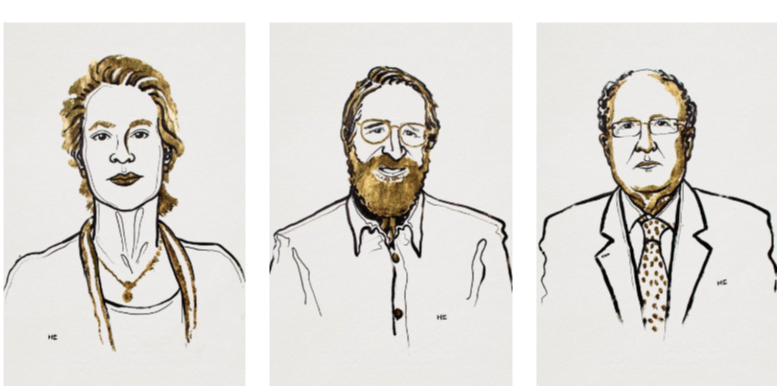
The 2018 Nobel Prize was announced this month and brought exciting science news. We select infographics […]