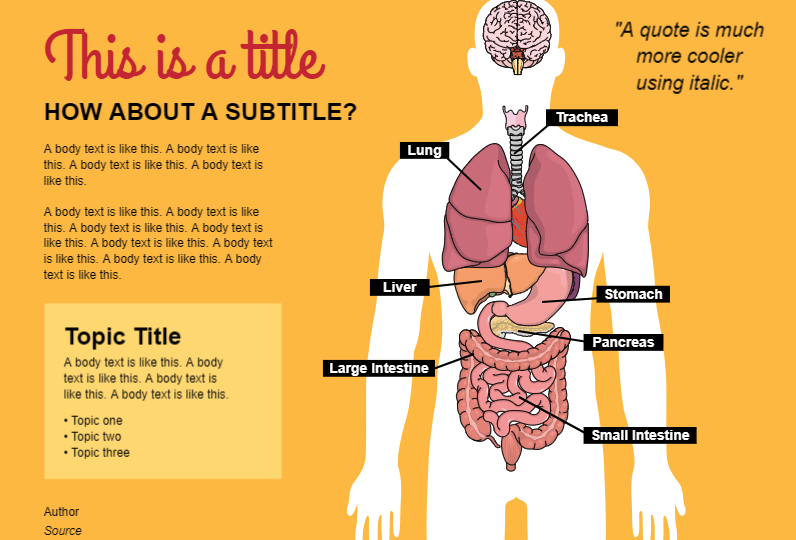
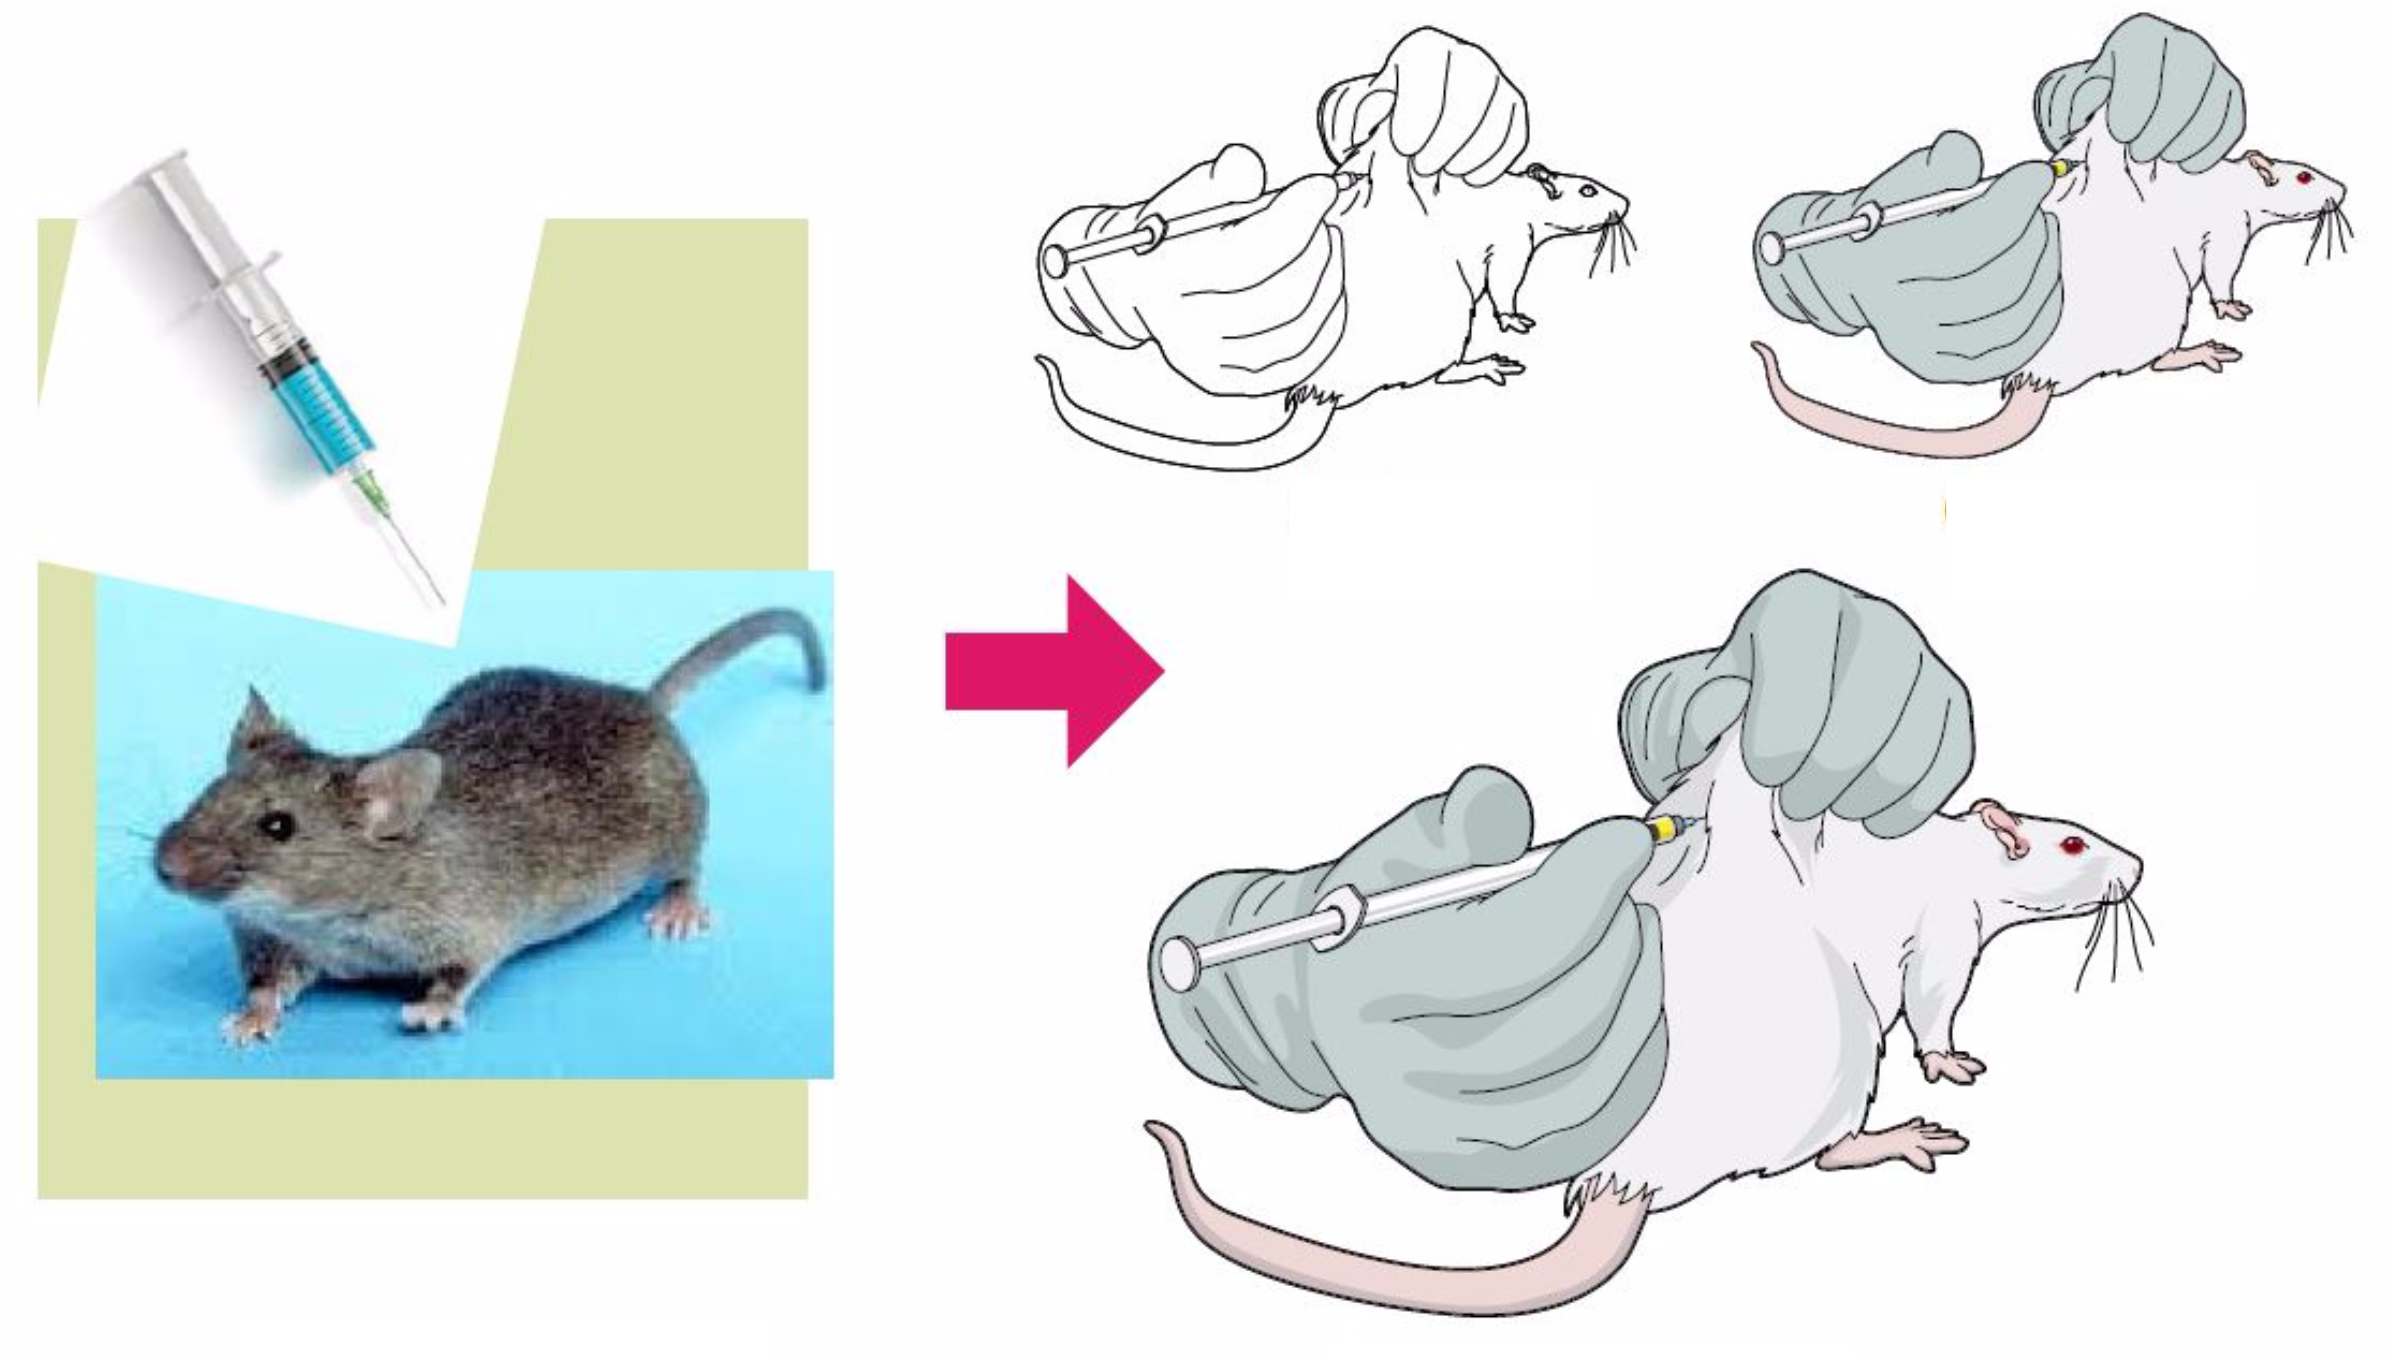
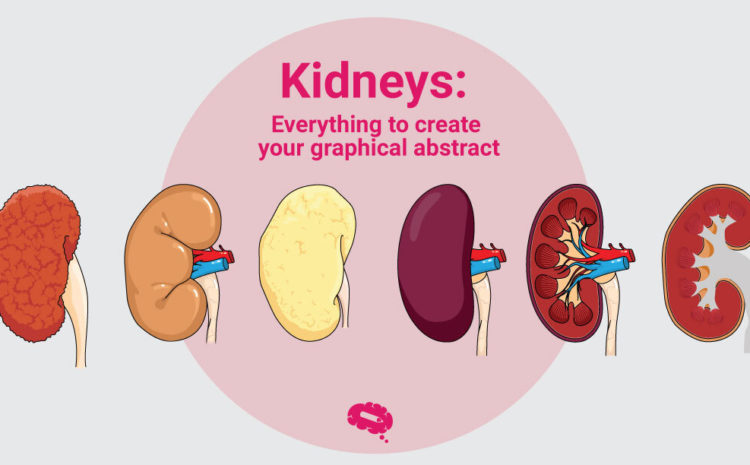
Mind the Graph is an online platform that allows scientists to create graphical abstracts and presentatios that are, at the same, beautiful and scientifically accurate. We are scientists as well, and we know our users aren’t designers. Therefore, we want more than provide scientific illustrations, we want to help our users in the creative process of making graphical abstracts.
Thinking of that, we produce tutorials weekly. You can find our content on the blog, email and, recently, our youtube channel. We added new videos showing how to create visual abstracts, presentations and congress posters. The videos are produced by our designers to show how to choose illutrations, colors, typography and organize all the information in a beautiful way. Also, there are tutorials to teach how to enjoy all the benefits of mind the graph.
Målet vårt er å styrke forskere og forbedre kommunikasjonen innen vitenskap. Derfor har vi laget denne videoserien for deg. Ved å se videoene og bruke plattformen kan du forbedre det du lager til forelesninger, seminarer og vitenskapelige artikler.
Se hvordan du lager grafiske sammendrag:

Abonner på nyhetsbrevet vårt
Eksklusivt innhold av høy kvalitet om effektiv visuell
kommunikasjon innen vitenskap.


