Ayahuasca: History and Compounds Analysis
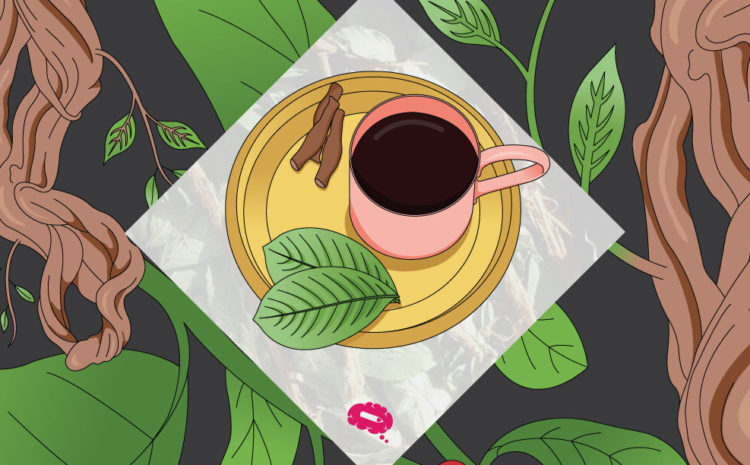
In the last few years, the interest in what is the psychoactive tea Ayahuasca has […]
Boost your infographic creations with tutorials and easy design tips, from basic to pro.
In the last few years, the interest in what is the psychoactive tea Ayahuasca has […]
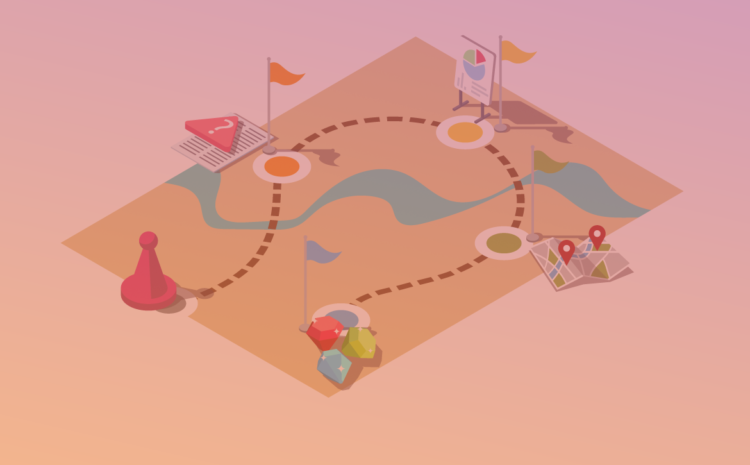
Regarding creating an infographic there are no rules. Not even an absolute truth. You can […]
Named after the brightest star in the night sky, Sirius is one of the first […]
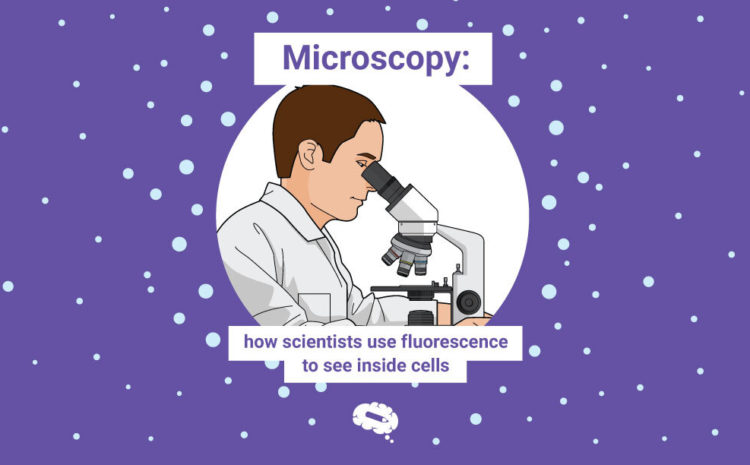
A great part of the scientist’s routine is to design and perform experiments. The combination […]
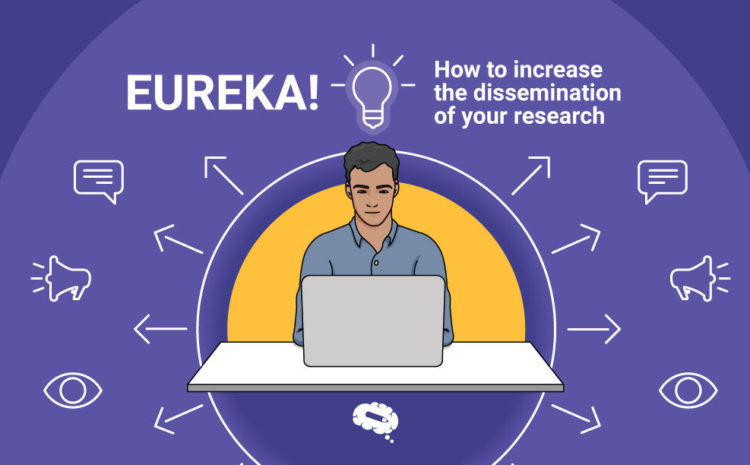
As researchers, we all get used to a traditional structure of scientific publications and scientific […]
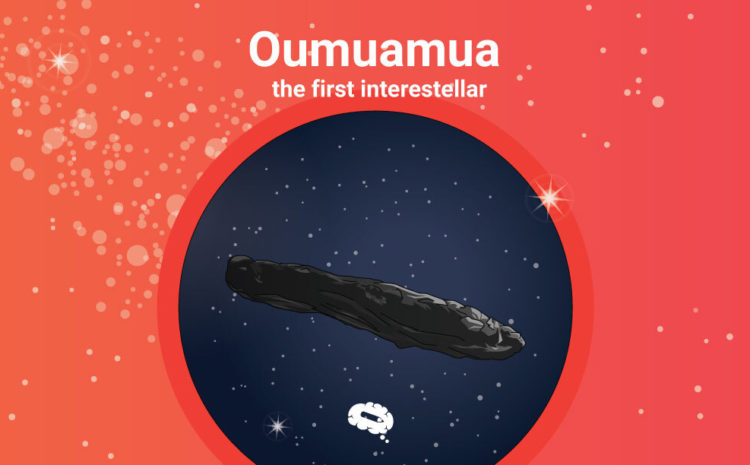
A little more than three years ago a strange object in the sky 2017 appeared. […]
Ever heard of Guernica? The Weeping Woman? Or the Girl With Mandolin? These are some […]
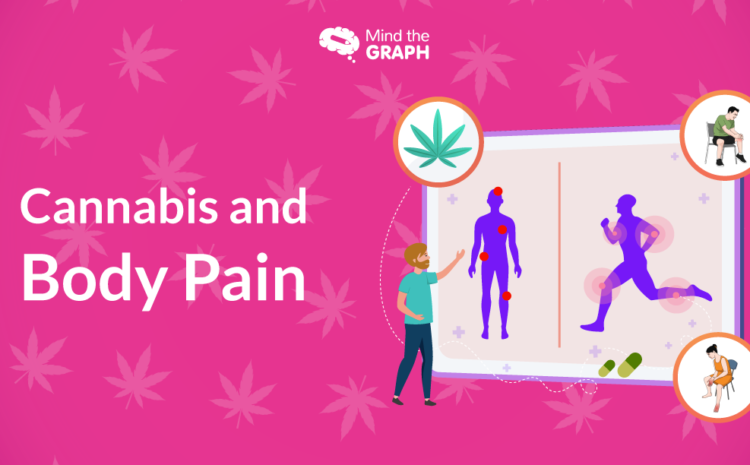
In the past decade many clinical trial studies reported positive and promising results in the […]
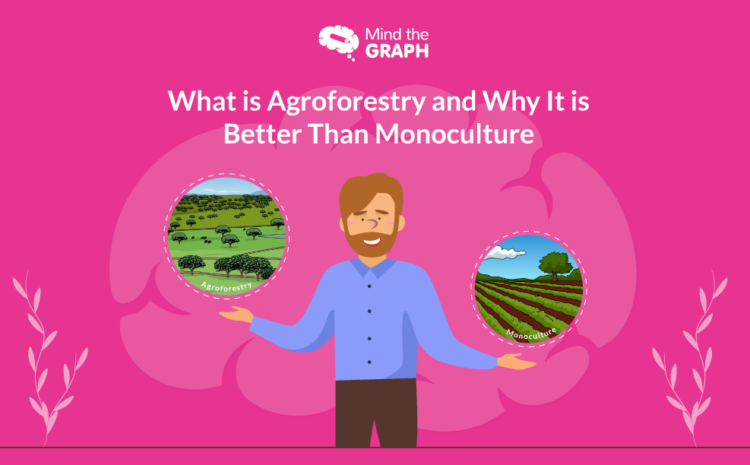
Monoculture has been the major form used by farmers and agriculturists to produce food in […]
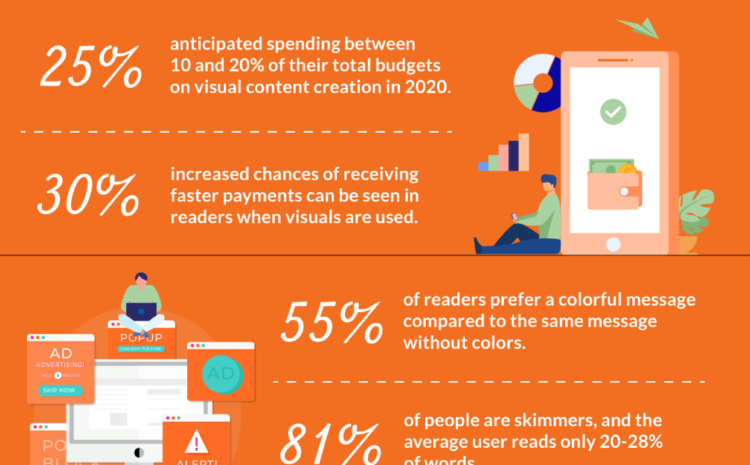
Online marketing is constantly evolving. The strategies that are relevant today might not be relevant […]
Unless you are living in a bubble, you would know that visual content marketing is […]