Boost your infographic creations with tutorials and easy design tips, from basic to pro.
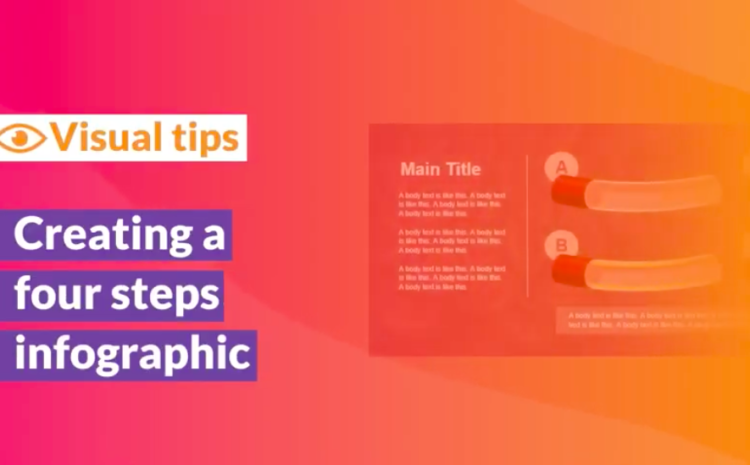
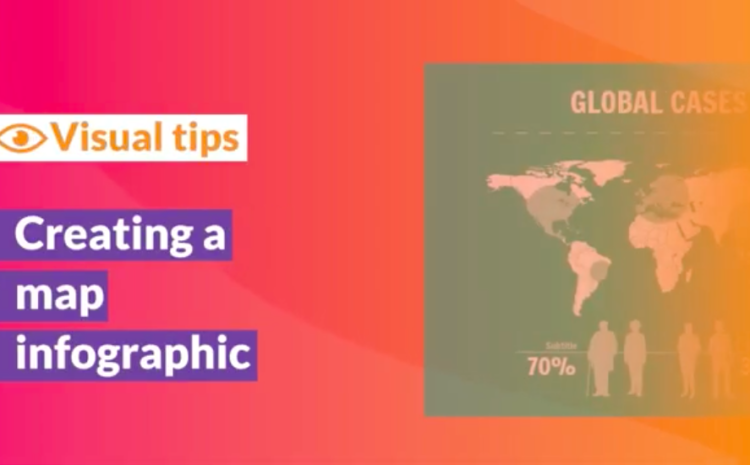
This tutorial video shows you how to create an infographic on Mind the Graph. The […]
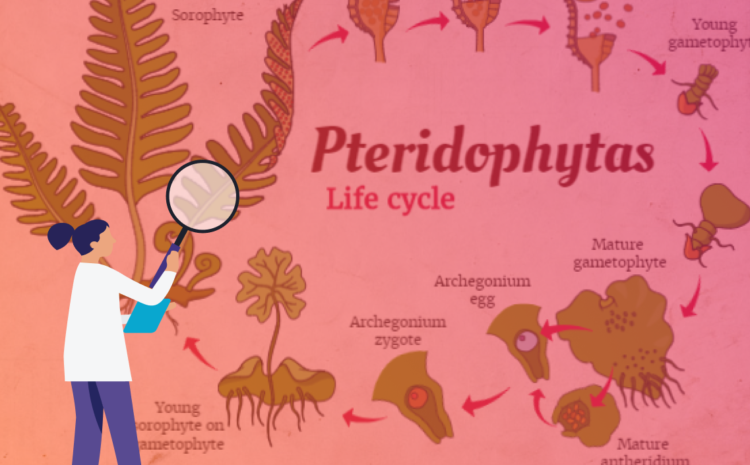
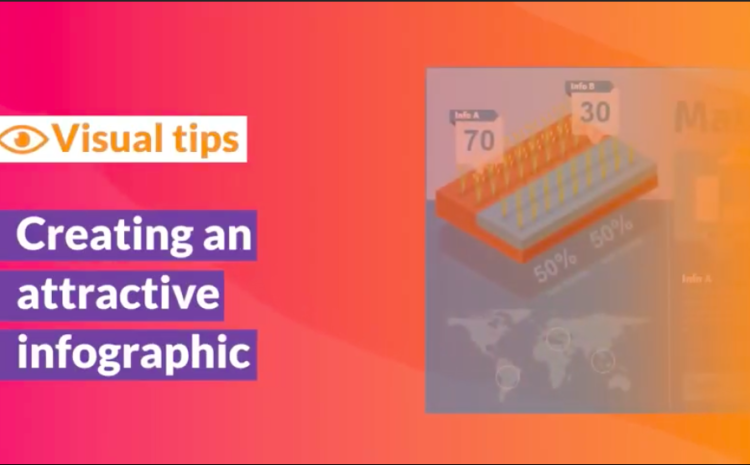
Tutorial video on how to create an attractive infographic with scientific illustrations on Mind the […]
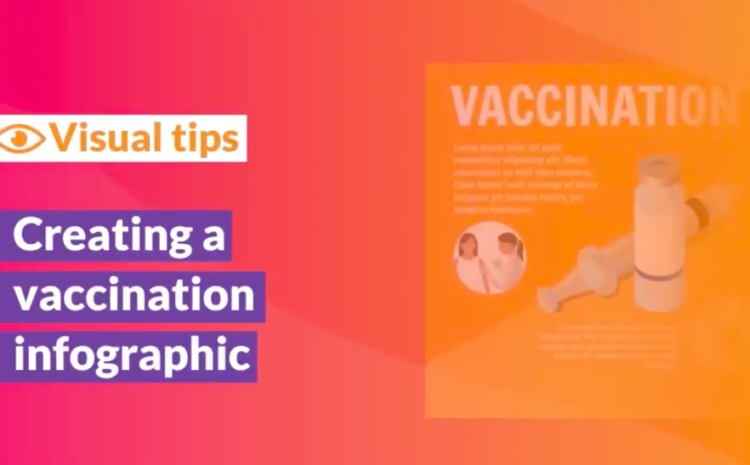
Tutorial video on how to create an attractive vaccination infographic with scientific illustrations on Mind […]
Tutorial on how to create an attractive vaccination infographic with scientific illustrations on Mind the […]