Regarding creating an infographic there are no rules. Not even an absolute truth.
You can create basically anything for an infographic.
There is no “never do that” or “this is wrong”.
The most important thing we must keep in mind while creating an infographic is to deliver the message in the best and easiest way possible.
If you have a complex topic to share with your public, an infographic may be a great way to pass this information; it becomes easy to explain and clearer to be understood.
This informativeness characteristic of the infographic is its best quality.
However, creating an infographic from scratch is not an easy task.
When we are starting an infographic from scratch, we find ourselves in one of these two situations: or we are full of ideas very different from one another, or we do not have any idea at all.
In the first case, we generally search and add to the creation space all the icons related to our topic, trying to find a way to organize it.
In the second case, we commonly search for random icons, finding nothing, zero inspiration, and we come back the way we started, with no ideas.
It is not an easy task let’s face it.

In order to help you with that struggle, we are going to share in this article important concepts to keep in mind when we talk about infographics.
We consider these concepts the main pillars that are the base for a good infographic.
Here are the three main pillars of infographics:
Write the minimum.
There is no need to explain everything and every single concept of your infographic, the visual does it all. Give the chance to your reader to understand it without the text. You can (and should) use keywords.
Share all the information in topics.
Sharing the information on the topic must feel like you are creating a diagram. Following a line of thoughts. Sharing topics is a great way to not tired your reader, and give it the sensation of a short and easy reading.
Use visual information.
Contrary to “write the minimum”, this is opened and not limited at all in any way. You can use any visual resource you think will better explain the message you want to pass to your reader. However, every image needs to have a purpose and a function inside the bigger picture of your infographic.
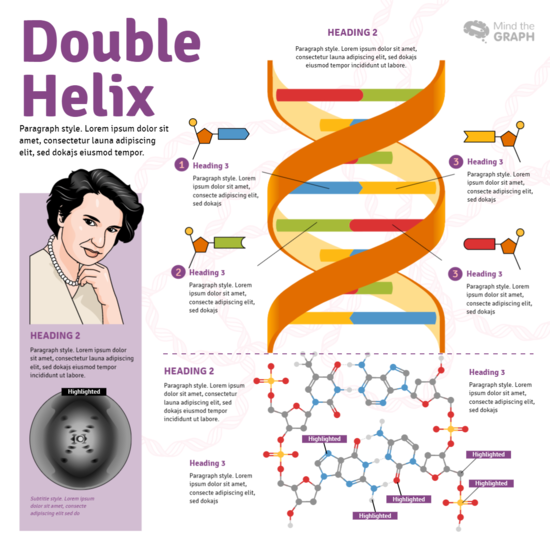
Let’s check out a practical example.
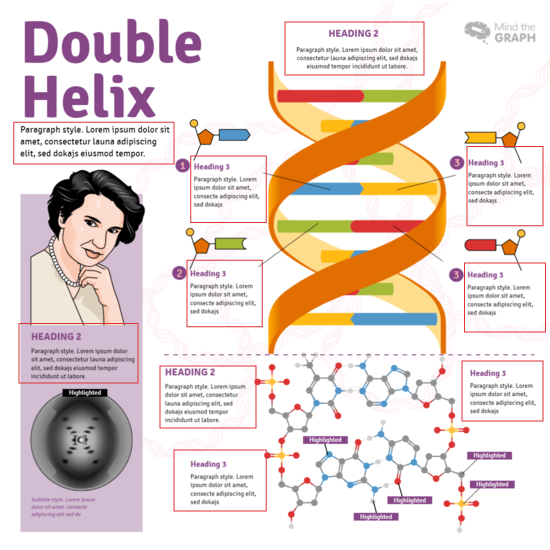
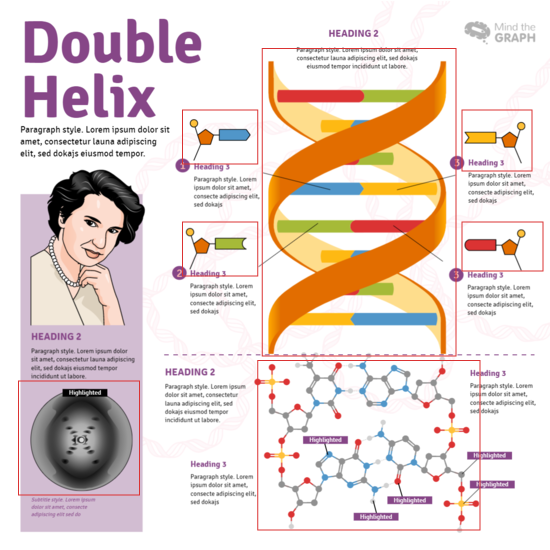
Below there is a ready template available in the Mind the Graph templates library. In order for you to see each pillar in the practice, we highlighted template icons with red squares.
Writing the minimum and sharing information on topics are always walking together. Share in topics will help you to write the minimum.
In the two following examples, you will see almost the same highlighted red squares.
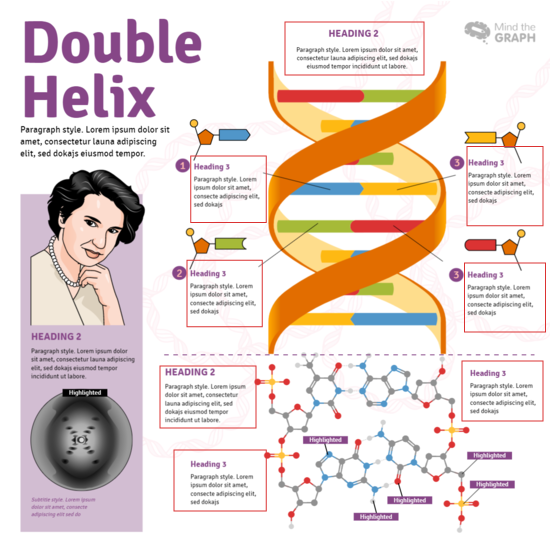
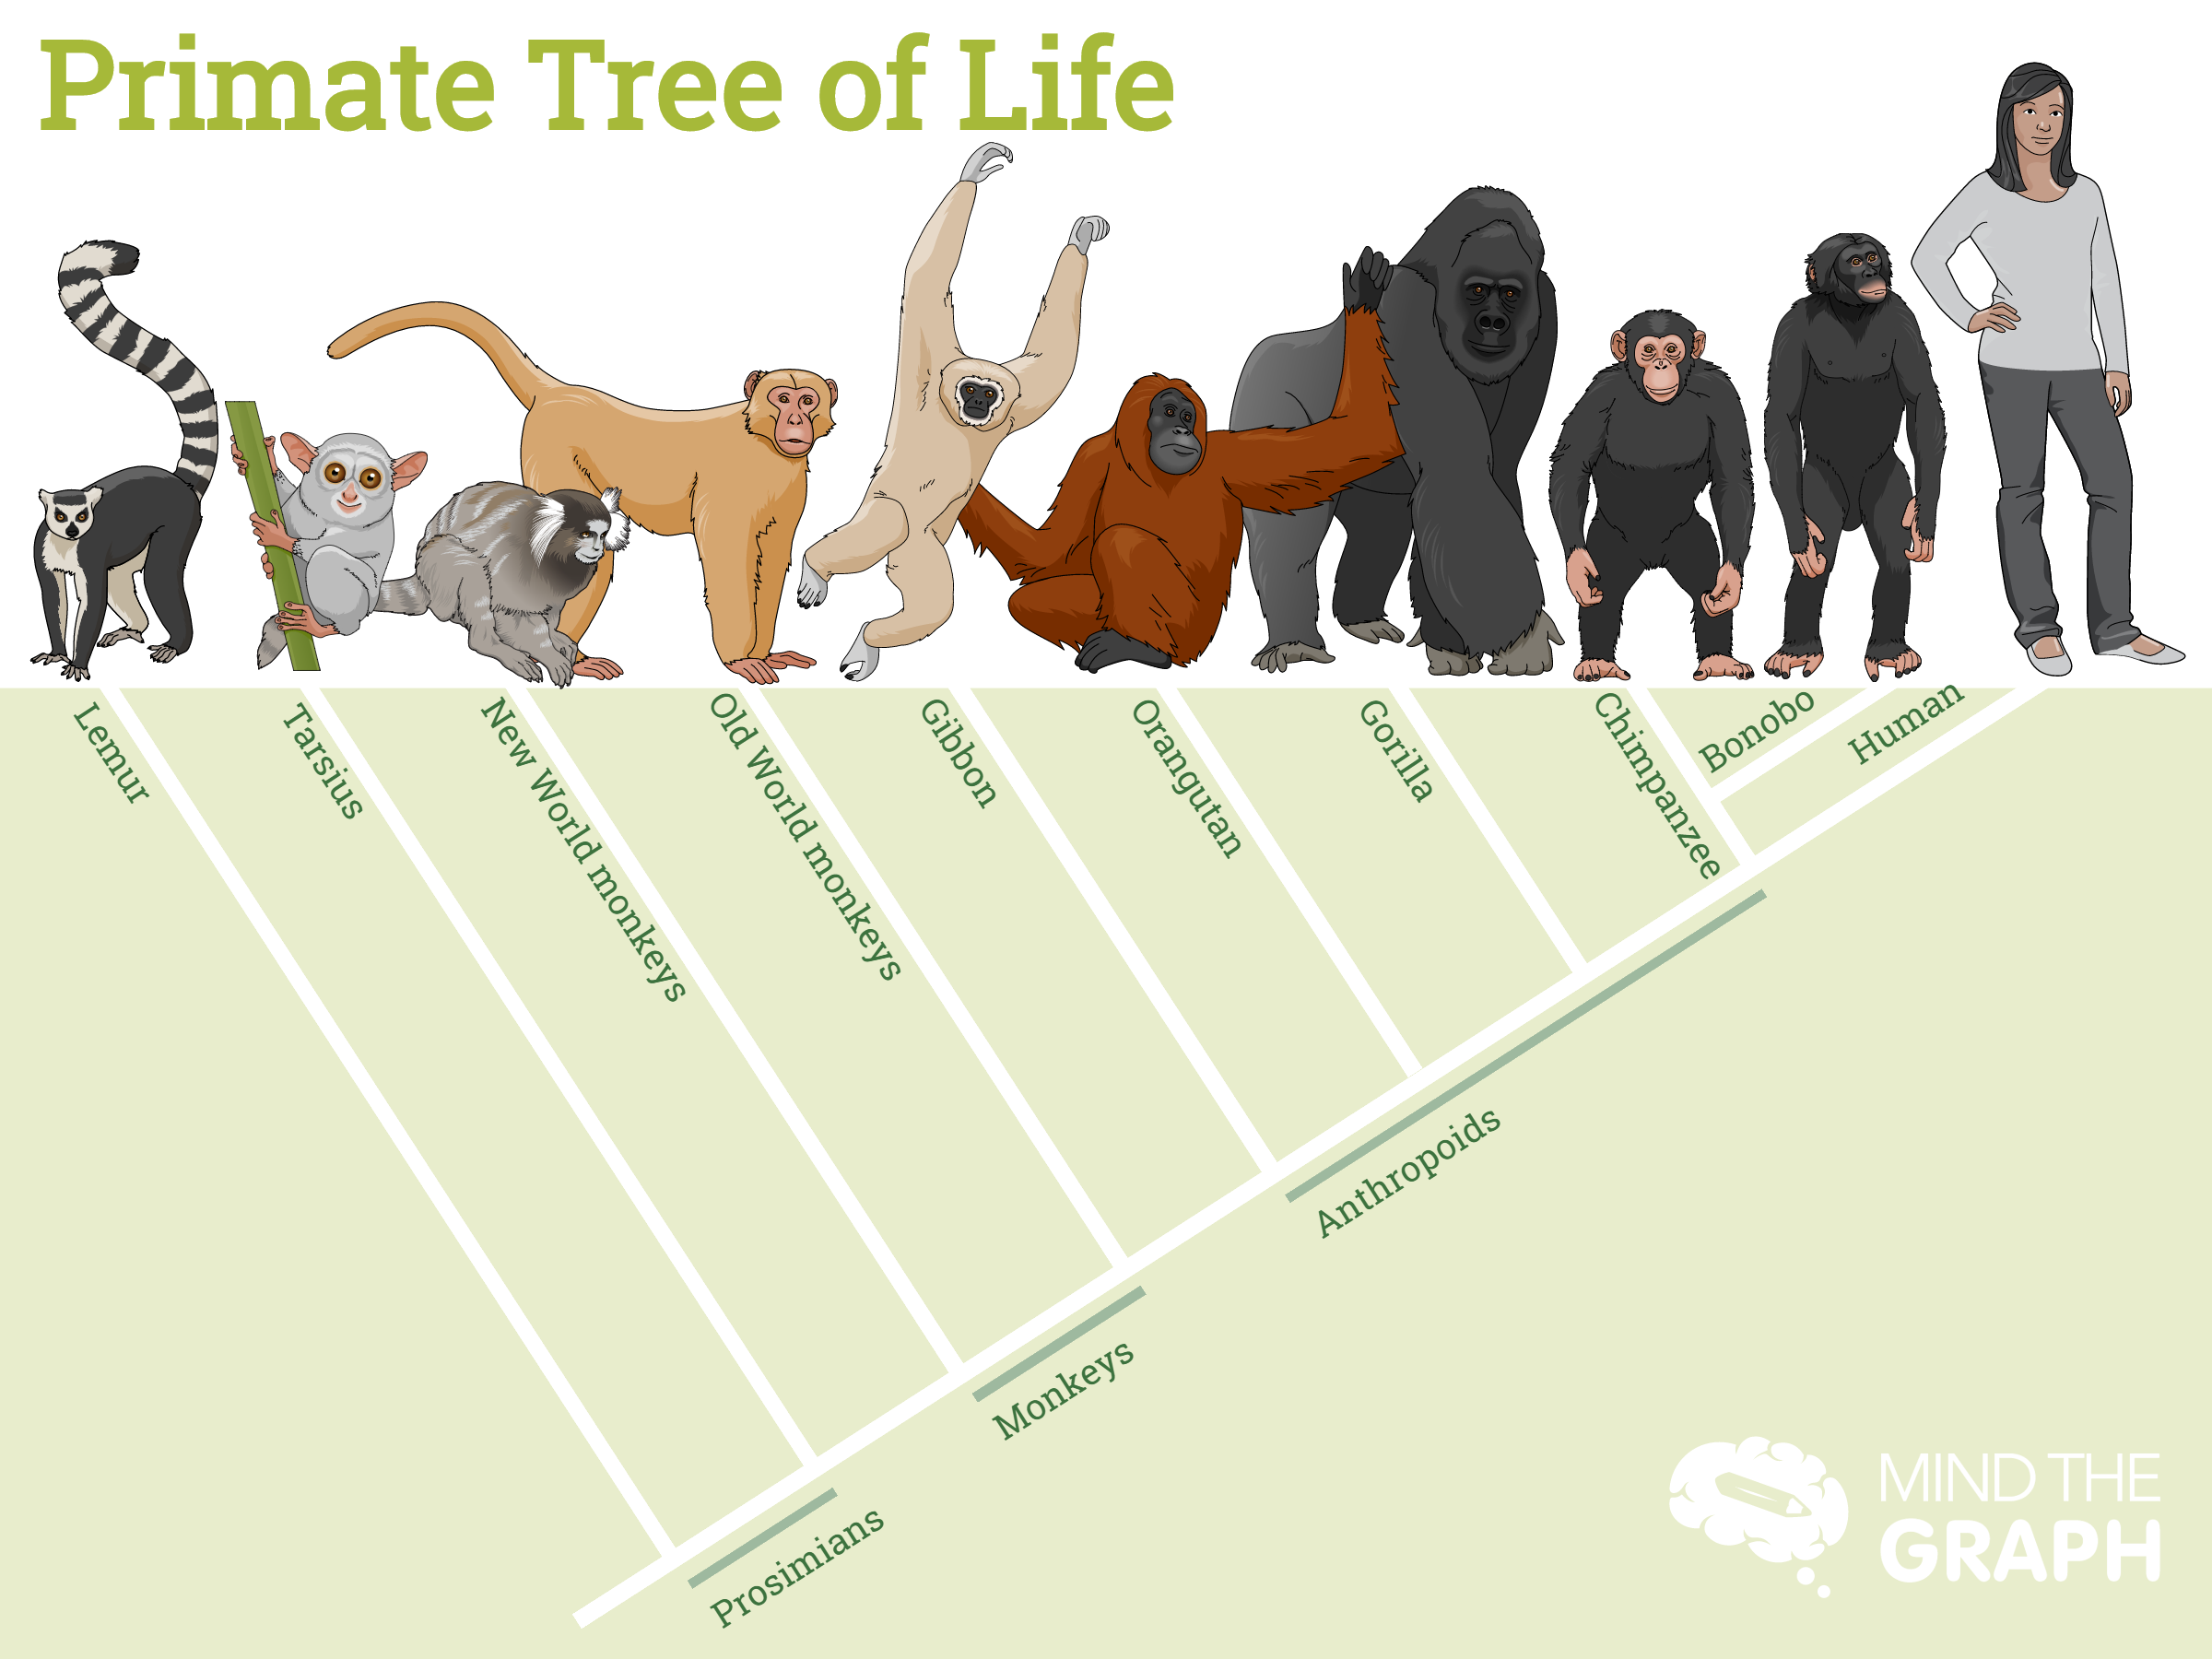
In this last example, check out the icons highlighted.
All these icons have a purpose and a meaning in the infographic, together it tells a story.
And, that’s all folks!
All the templates in Mind the Graph templates-library follow these three pillars. Click here to see all templates available.
We hope this helps you to produce your best infographic ever. Keep these three pillars in mind at all times while creating your infographic.

Now, let’s put that into practice?
Start your creation right now in Mind the Graph!


Subscribe to our newsletter
Exclusive high quality content about effective visual
communication in science.