2 min read
06/16/2016
Mind The Graph Scientific Blog is meant to help scientists learn how to communicate science in an uncomplicated way.
One of the biggest discussions in the scientific world is the open access to scientific data. As researchers, we feel the pain of willing to read a paper and not having free access to it. Even though many universities provide open platforms, a pirate market still exists for scientific information. Buying scientific papers may not […]
This week, Overleaf published a guest post from Mind the Graph. Our CEO Fabricio Pamplona […]
If we talk about science, the word “future” usually comes along. We always think about […]
Scientists are known for their poorly made presentations and posters. However, our degrees do not […]
Mind the graph is a DIY platform that already has many scientific illustrations available for […]
For undergrads and grad students in Biomedical sciences, it’s common to face the need to […]
What is the first tool you think about when you need to put a presentation […]
Our Terms of use and Privacy Policy have been updated. Don’t miss what is going on at Mind […]
You rather receive relevant information from images than texts. How do I know this? Because […]
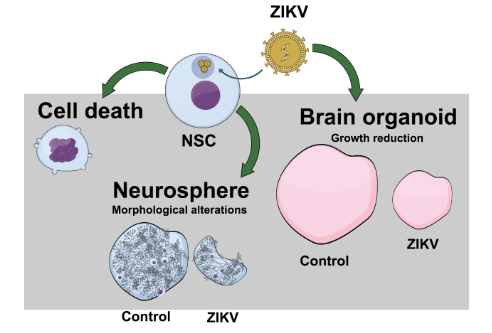
Understand Zika virus graphical abstract: How it reduces brain size Today a research study added […]
One of the biggest fears in the academic world is doing a presentation. Maybe you […]
For a long time doing science meant having great insights about nature mechanisms. As it […]
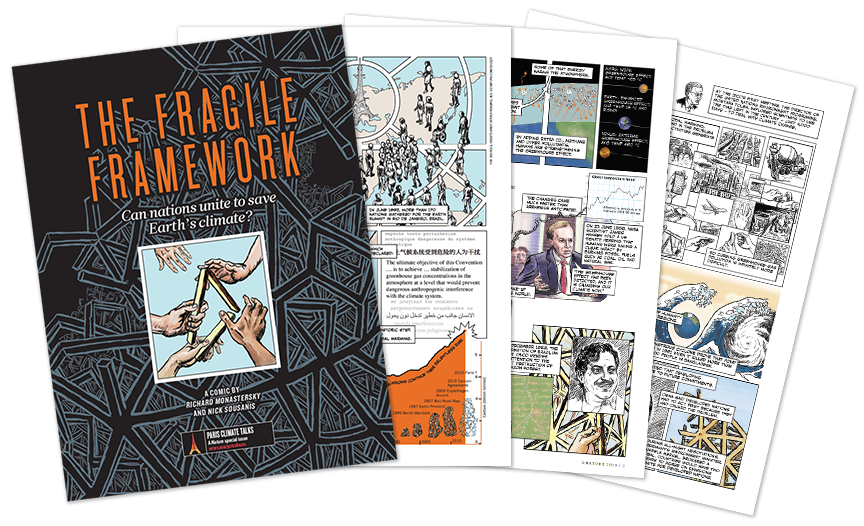
In times of climate change and COP21, all awareness is needed to show politicians how […]