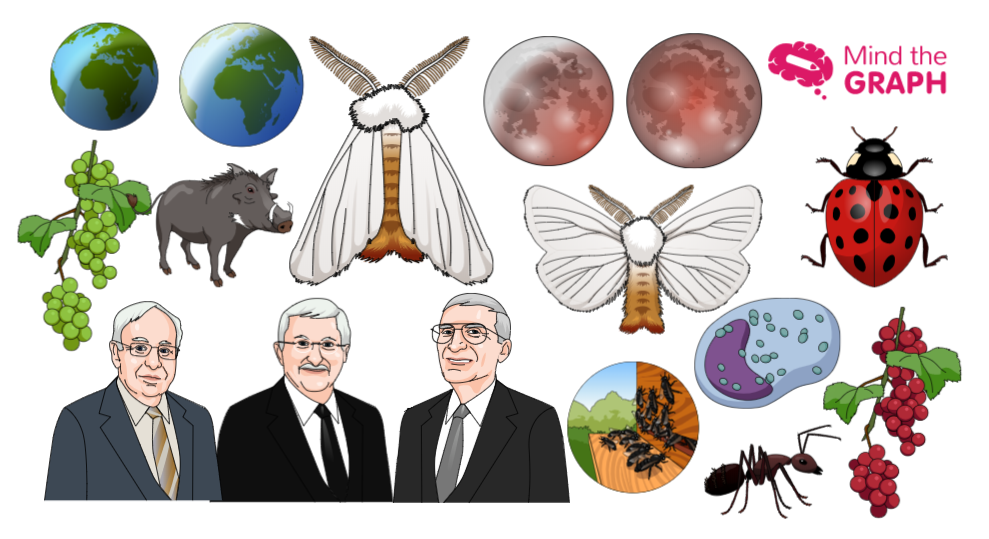
Hi there! We have new scientific illustrations for you! Every friday we show waht is new on mind the graph, so you can catch up the news on our blog. But besides these illustrations, we already have over eight thousand others available on our platform.
New scientific illustrations
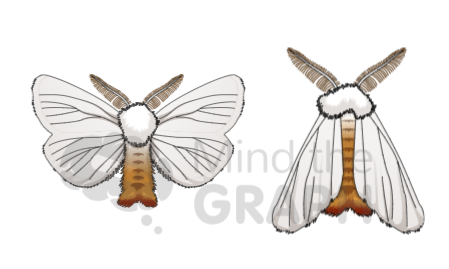
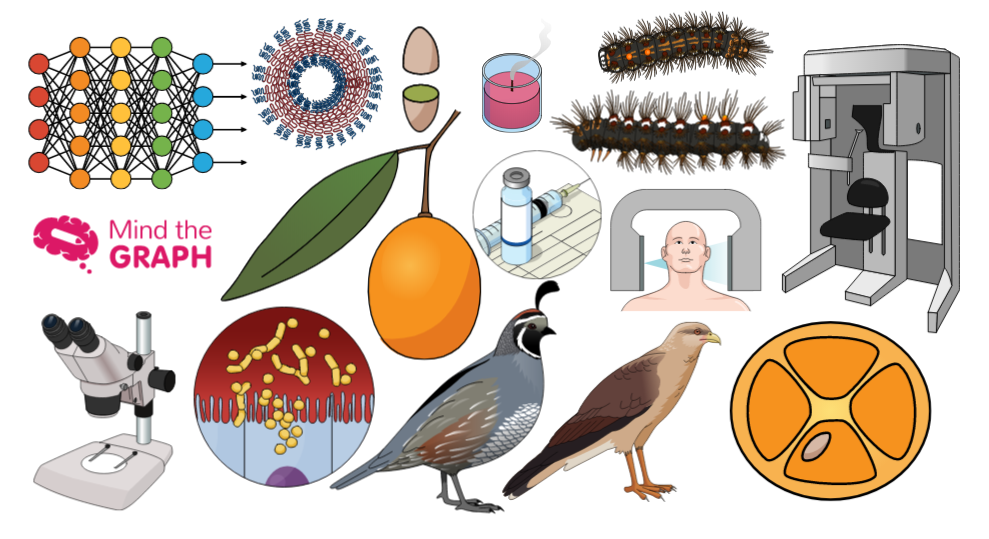
Euproctis chrysorrhoea
Aka the brown-tail moth, is native of Europe, Asia and north of Africa. The brown-tail moth produces one generation a year. It has four life stages: egg, larval, pupal, and adult. We already have the illustrations of larvae available but this week we added the adult form.
Nobel prize winners
Tomas Lindahl, Paul Modrich and Aziz Sancar won The Nobel Prize in Chemistry 2015 jointly “for mechanistic studies of DNA repair.” We also have other illustrations of scientists, as Sir Alexander Fleming.
Grapes
Have you ever heard about Enology? It is the science and study of wine and winemaking; distinct from viticulture, the agricultural endeavours of vine-growing and of grape-harvesting. So, if you are an enologist or just a wine lover, check our complete category of enology.
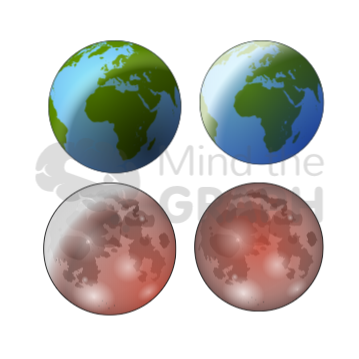
Earth and moon eclipse
A lunar eclipse occurs when the Moon passes directly behind Earth and into its shadow. But this can occur only when the Sun, Earth, and Moon are exactly or very closely aligned, with Earth between the other two. On the other hand, a solar eclipse occurs when the Moon passes in front of the Sun.
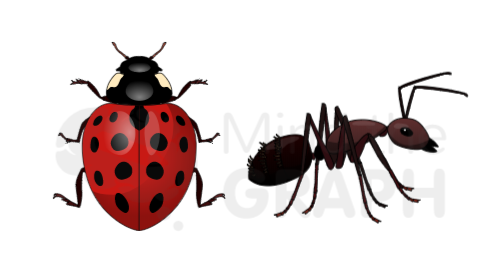
Insects
Coccinellidae is a widespread family of small beetles known as ladybugs. However, entomologists prefer the names ladybird beetles or lady beetles as these insects are not classified as true bugs.
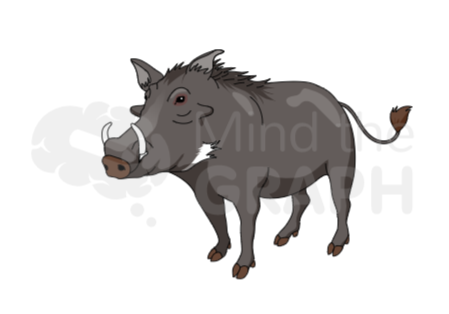
Warthog
The common warthog (Phacochoerus africanus) is a wild member of the pig family (Suidae) found in grassland, savanna, and woodland in sub-Saharan Africa.
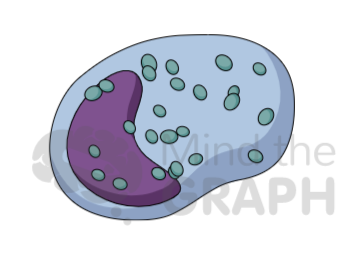
Mast cell
It is a part of the immune and neuroimmune systems. They have an important role in allergy and anaphylaxis pathways. However, mast cells also play an important protective role. They are involved in angiogenesis, immune tolerance, defense against pathogens, and blood–brain barrier function.
How can I use these illustrations in my publications?
Yes. Mind the Graph is an online platform to allow scientists to create eye-catching scientific presentations, graphical abstracts, infographics and more. Besides the library of scientific illustrations, you can use text, charts, icons and upload your own images to create a complete presentation. You can try it for free or upgrade to have unlimited features. Moreover, our illustrations are based on requests from our subscribers. So, if you don’t find the one you need, you can request it at no extra cost.

Subscribe to our newsletter
Exclusive high quality content about effective visual
communication in science.

