Mind the Graph Blog
  • Infographic maker
  • How it works
  • Tutorials
  • Portfolio
Mind the Graph Blog

#23 Scientific illustrations of the week: Don’t miss it!

Fabiola Soares Portfolio August 16, 2019
Hi there! We have new scientific illustrations for you! Every friday we show waht is new on mind the graph, so you can catch up the news on our blog. But besides these illustrations, we already have over eight thousand…Read more
wave

Infographics to explain the 2018 Nobel Prize

Fabiola Soares Inspiration October 31, 2018
The 2018 Nobel Prize was announced this month and brought exciting science news. We select infographics to help you understand the research of  the winners of Medicine, Chemistry and Physics. The infographics were made by Compound Interest, a platform to improve…Read more
wave

Nobel prize 2015: fighting malaria and neglected diseases

Fabricio Pamplona Trends October 5, 2015
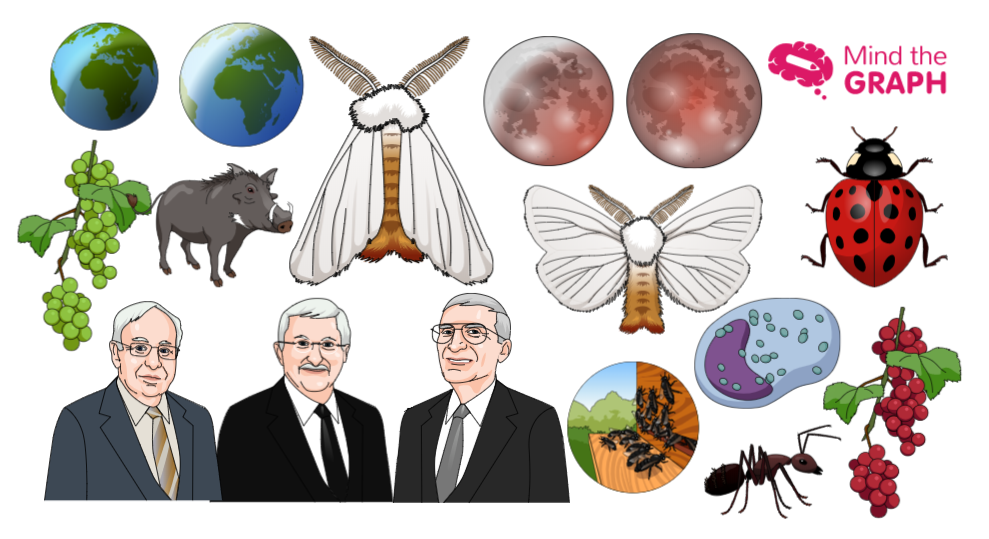
The Nobel prize 2015 in medicine was awarded to three scientists that have studied treatments for neglected diseases, such as malaria and infections caused by parasitic worms. The Nobel prize 2015 will not be equally distributed: the Chinese researcher Youyou…Read more
wave

Create beautiful scientific
infographics with no effort

We turn scientists into designers to boost your impact. Globally.

Try for free
TRUSTED BY
Mind The Graph Logo
Mind the Graph Facebook Mind the Graph Instagram Mind the Graph Linkedin Mind The Graph Blog Mind the Graph Twitter Mind the Graph YouTube
Cactus Communications Logo

© 2022, Cactus Communications. All Rights Reserved