Mind the Graph and 3D Protein Imaging
Ever tried to create a molecular illustration with classic molecular viewers? If the answer is […]
This category contains all you need to know about science design for research papers.
Ever tried to create a molecular illustration with classic molecular viewers? If the answer is […]
Graphical abstracts and Cell Press If we stop for a second and analyze, graphical abstracts […]
Graphical Abstracts and Nature Chemistry Presenting scientific articles in a new and innovative way to […]
Infographics in Healthcare How many times did you find yourself reading flyers in the waiting […]
The Poster Maker is a new tool created by Mind the Graph’s team, that helps scientists create beautiful scientific posters with no effort.
In the last few years, the interest in what is the psychoactive tea Ayahuasca has […]
Named after the brightest star in the night sky, Sirius is one of the first […]
As researchers, we all get used to a traditional structure of scientific publications and scientific […]
Ever heard of Guernica? The Weeping Woman? Or the Girl With Mandolin? These are some […]
Do you want to know how to make your research papers stand out through charts and graphs? Then this blog is what you need. Read it now!
Canva is surely one of the best graphic design tools we have on the web. […]
Visuals such as Infographics and presentations are a great content marketing tool. However, they might […]
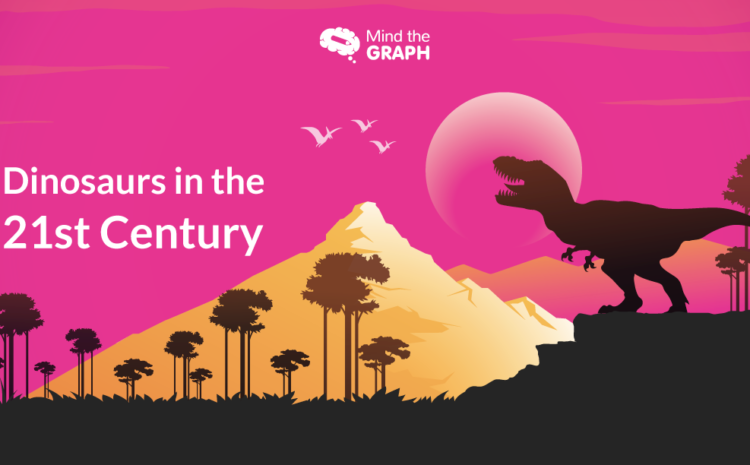
That dinosaurs were extinct – about 65.5 million years ago – is not news for […]